Pipeline Execution History
This topic describes how to navigate to the execution history of pipelines and what information is contained within.
Where Can I Find Execution History?
You can find the execution history of your pipeline or all pipelines in a project in the following places in the Harness UI.
Executions Tab
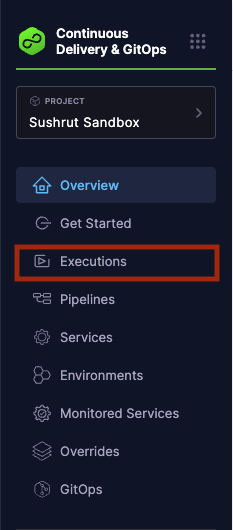
You can view the execution history of all pipelines for a given project in the Executions tab in the left navigation of the Harness UI:
Pipelines Tab
You can view the execution history of all pipelines for a given project in the Pipelines tab also.
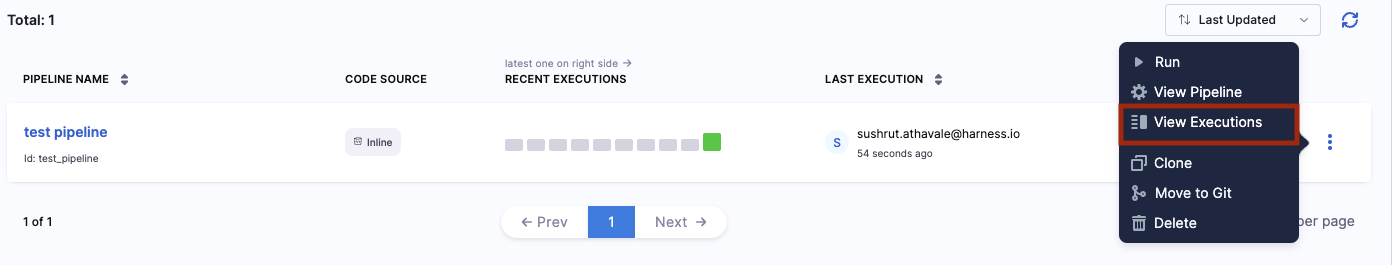
In the Harness UI left navigation, select Pipelines. A list of pipelines created under the project appears.
Select the more actions button on the right for the pipeline of your choice, and then select View Executions.
Pipeline Studio
You can view the execution history of a specific pipeline using Pipeline Studio.
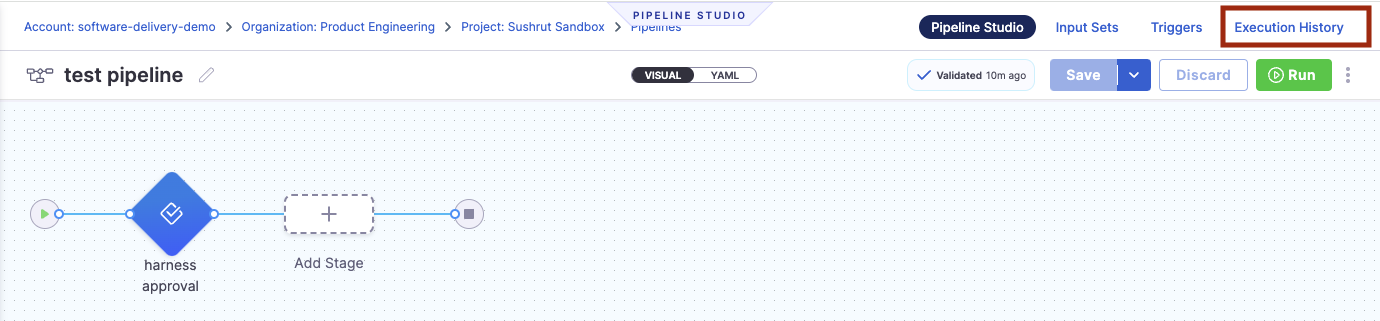
In the Harness UI left navigation, select Pipelines, and then select the pipeline for which you want to view the execution details.
Select the Execution History option on the top right corner of the page to view the execution details.
Execution Reference
Each pipeline execution displays the following information.
-
Pipeline Name
- The name of the pipeline and execution ID.
- When expanded, this column also shows the name of each stage in the pipeline.
-
Status
- Shows the status of the execution. The options are
SUCCESS,FAILED,ABORTED,EXPIRED. - When expanded, this column shows the status of each stage as an emoji. You can hover over the emoji for more information.
- Shows the status of the execution. The options are
-
Trigger Summary
- This column shows the origin of each execution.
- The origin of each execution is the trigger type which initiated the pipeline execution.
-
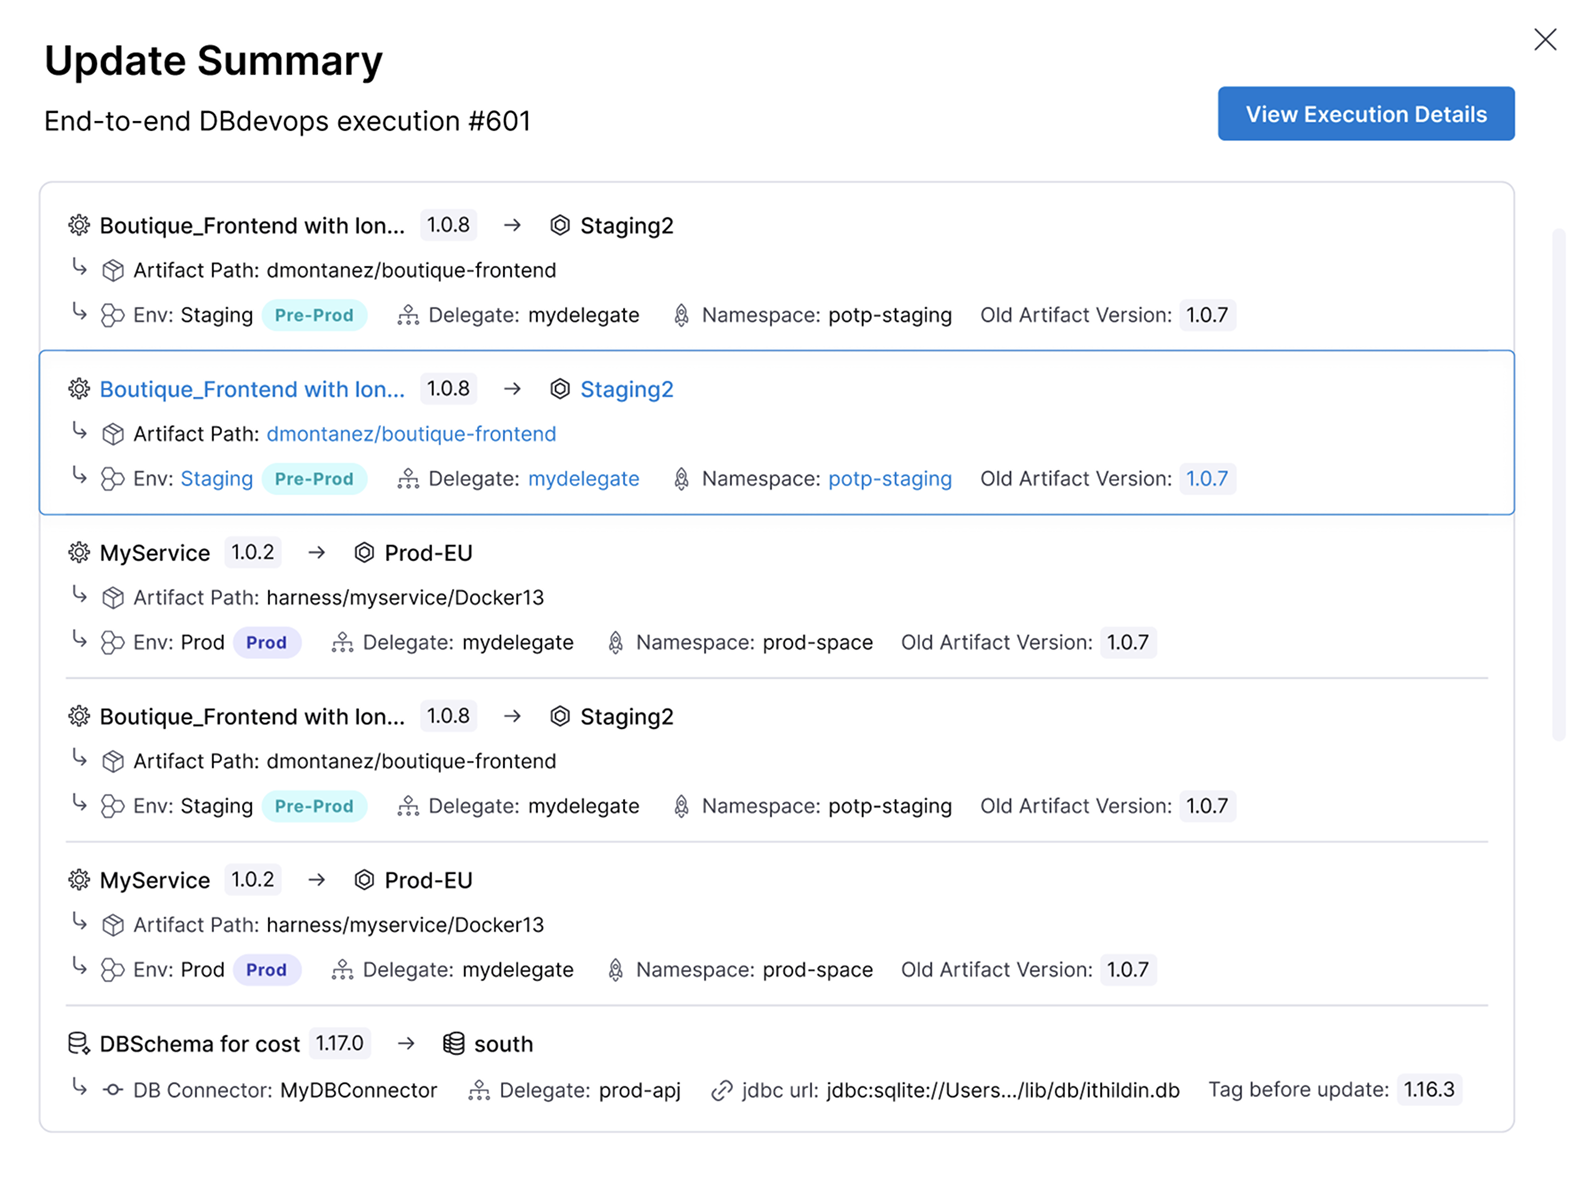
Update Summary
-
This column shows execution information for CD and Database DevOps modules.
-
The Update Summary behaves differently based on the module(s) used in the pipeline:
Module Information Shown Example On-hover CD The update summary for CD shows Service → Environment mappings. service1 → environment1Hovering on the service name displays attached artifact version, tag, path and hovering on the environment name displays attached infrastructure. Database DevOps The update summary for Database DevOps shows Schema Version → DB Instance mappings. schema_v34 → orders-db-prodHovering on the schema version displays schema, hovering on the DB instance displays the DB instance and tag (if any). - You can also visualize the mappings and view stage-wise execution details by simply expanding the card after clicking on the
chevron-righticon as shown in the image below.
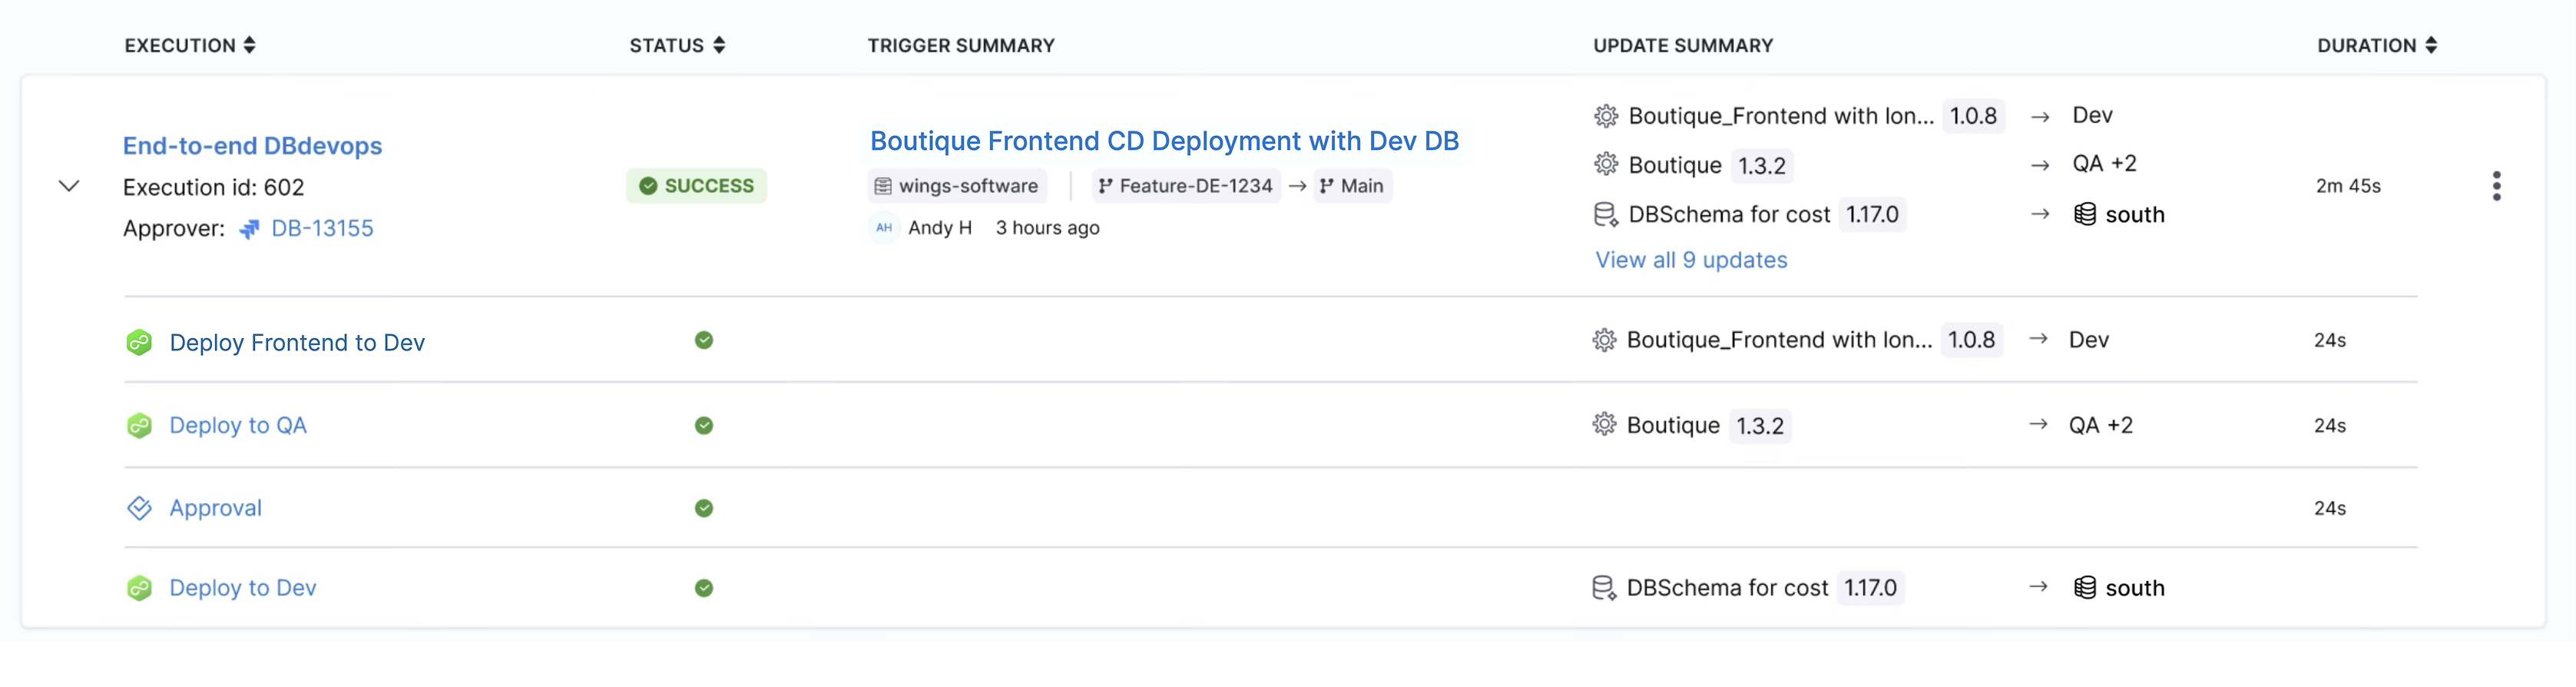
- If there are more than three updates, let's say n updates, a
View all n updatesindicator appears, and clicking on it opens a popup which reveals the full list of stage-wise updates. The same popup can be opened by clicking on theView Detailsoption which shows up when there are less than or equal to 3 updates. You can also navigate to the execution details using theView Execution Detailsoption in this popup.
-
-
Execution Start Time
- Shows the user, method, and start time of the execution.
-
More details The more details icon for each pipeline offers additional execution actions:
- Add Execution Notes
- Re-run from stage
- View Execution
- View Pipeline
- Re-run Pipeline
- Abort Pipeline
- View Compiled YAML
- Compare Pipeline Executions
- Download Logs
Filter executions
You can filter pipeline executions using the filters in the Execution History or Execution tabs.
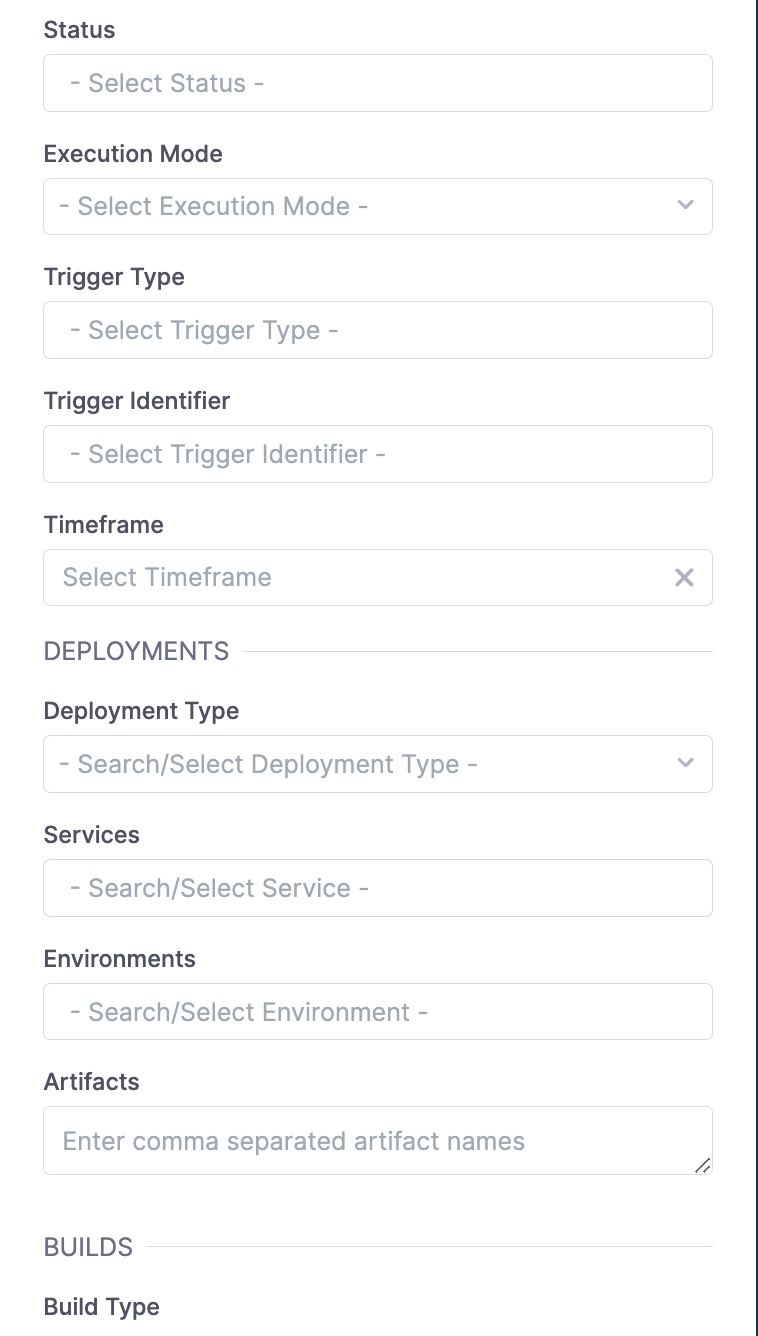
You can filter pipeline execution based on Status, Execution Mode, Trigger Type, Trigger Identifier, Timeframe, Deployment Type, Services, Environments, Artifacts or Build Type.
Select your filters
- Legacy Filter UI
- New Filter UI
You can use default filter options show at the top such as Status, Pipelines, or Select Repository, or use more filter options by clicking the filter icon next to Select a Saved Filter.
Here you can click +New Filter to create and store filters for future use.
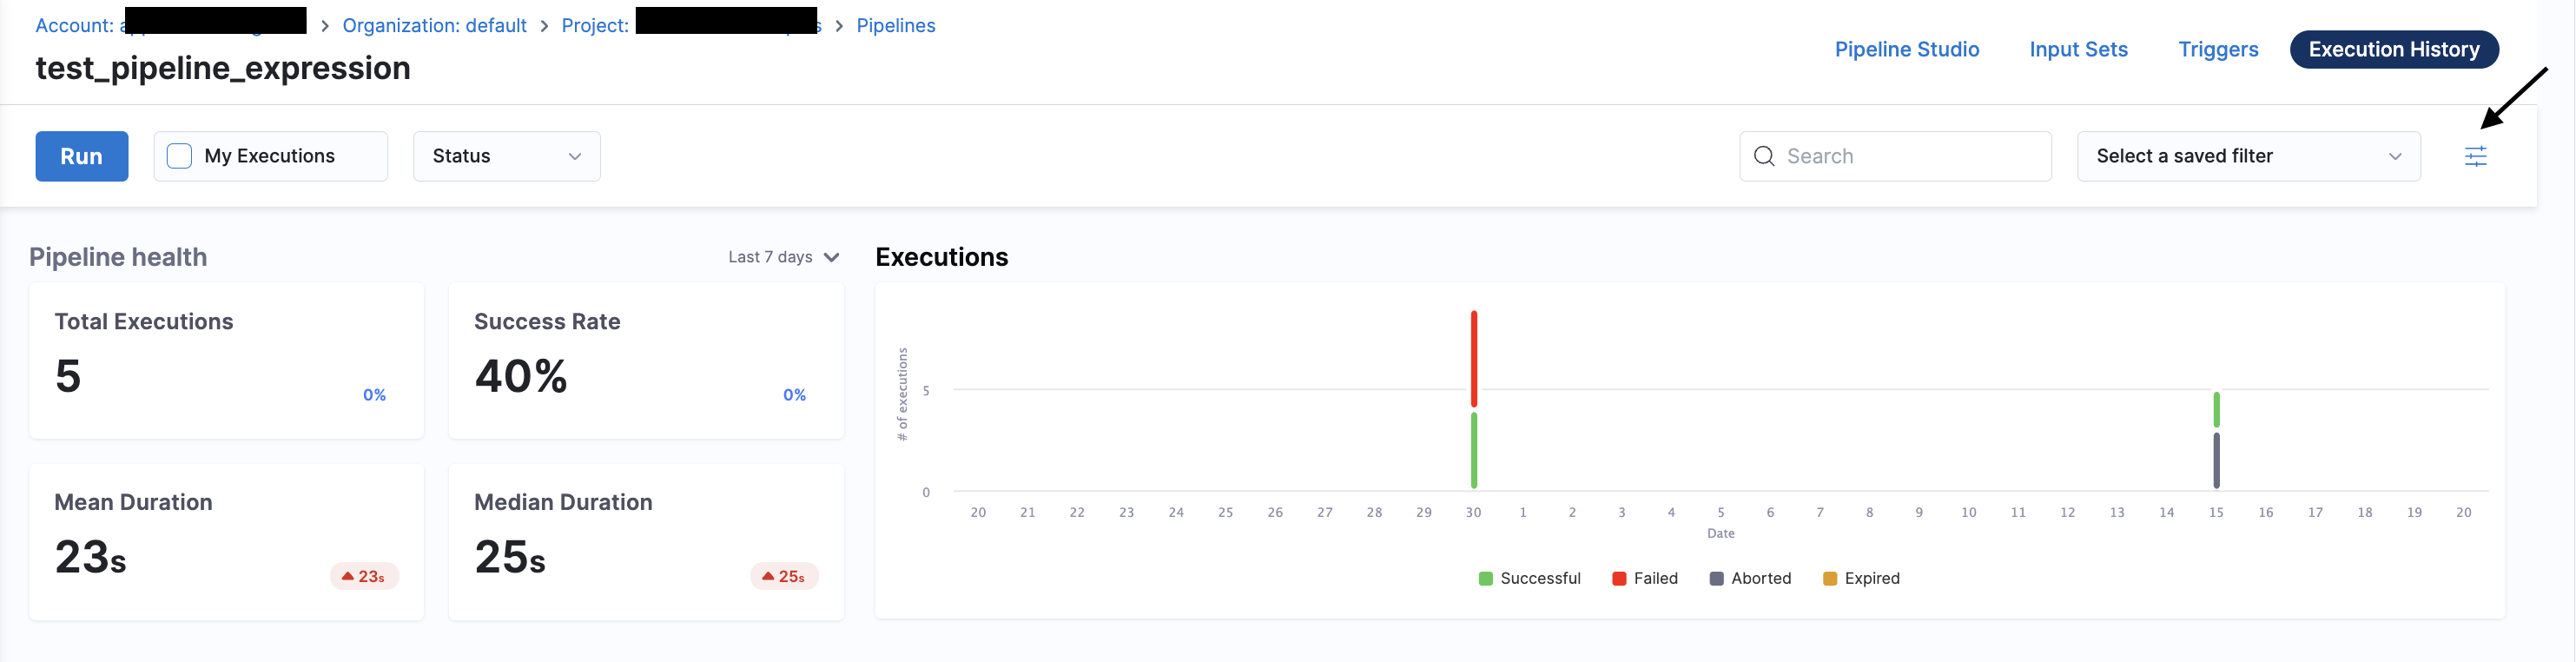
You can use the new filter UI by enabling the feature flag CDS_EXECUTION_LIST_FILTERS. Contact Harness Support to enable this feature.
You can use default filter options such as My Executions, Status, or Timeframe, or use more filter options by clicking the +Add Filter button.
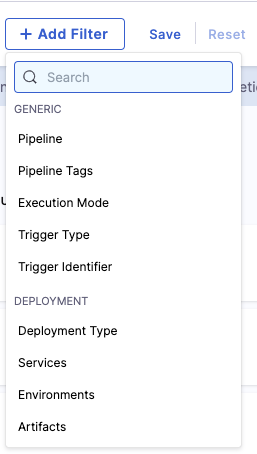
You can save your current filter settings by clicking Save and you can reference those saved filters by clicking the filter icon dropdown at the top right.
Status
Filter pipeline execution based on Status of Pipeline Execution.
It includes:
- Aborted
- Aborted By Freeze
- Expired
- Failed
- Not Started
- Paused
- Queued
- Running
- Success
- Suspended
- Resource Waiting
- Async Waiting
- Skipped
- Task Waiting
- Timed Waiting
- Errored
- Ignore Failure
- Discontinuing
- Approval Rejected
- Intervention Waiting
- Approval Waiting
- Pausing
- Input Waiting
- Wait Step Running
- Queued License Limit Reached
- Queued Execution Concurrency Reached
View Execution History
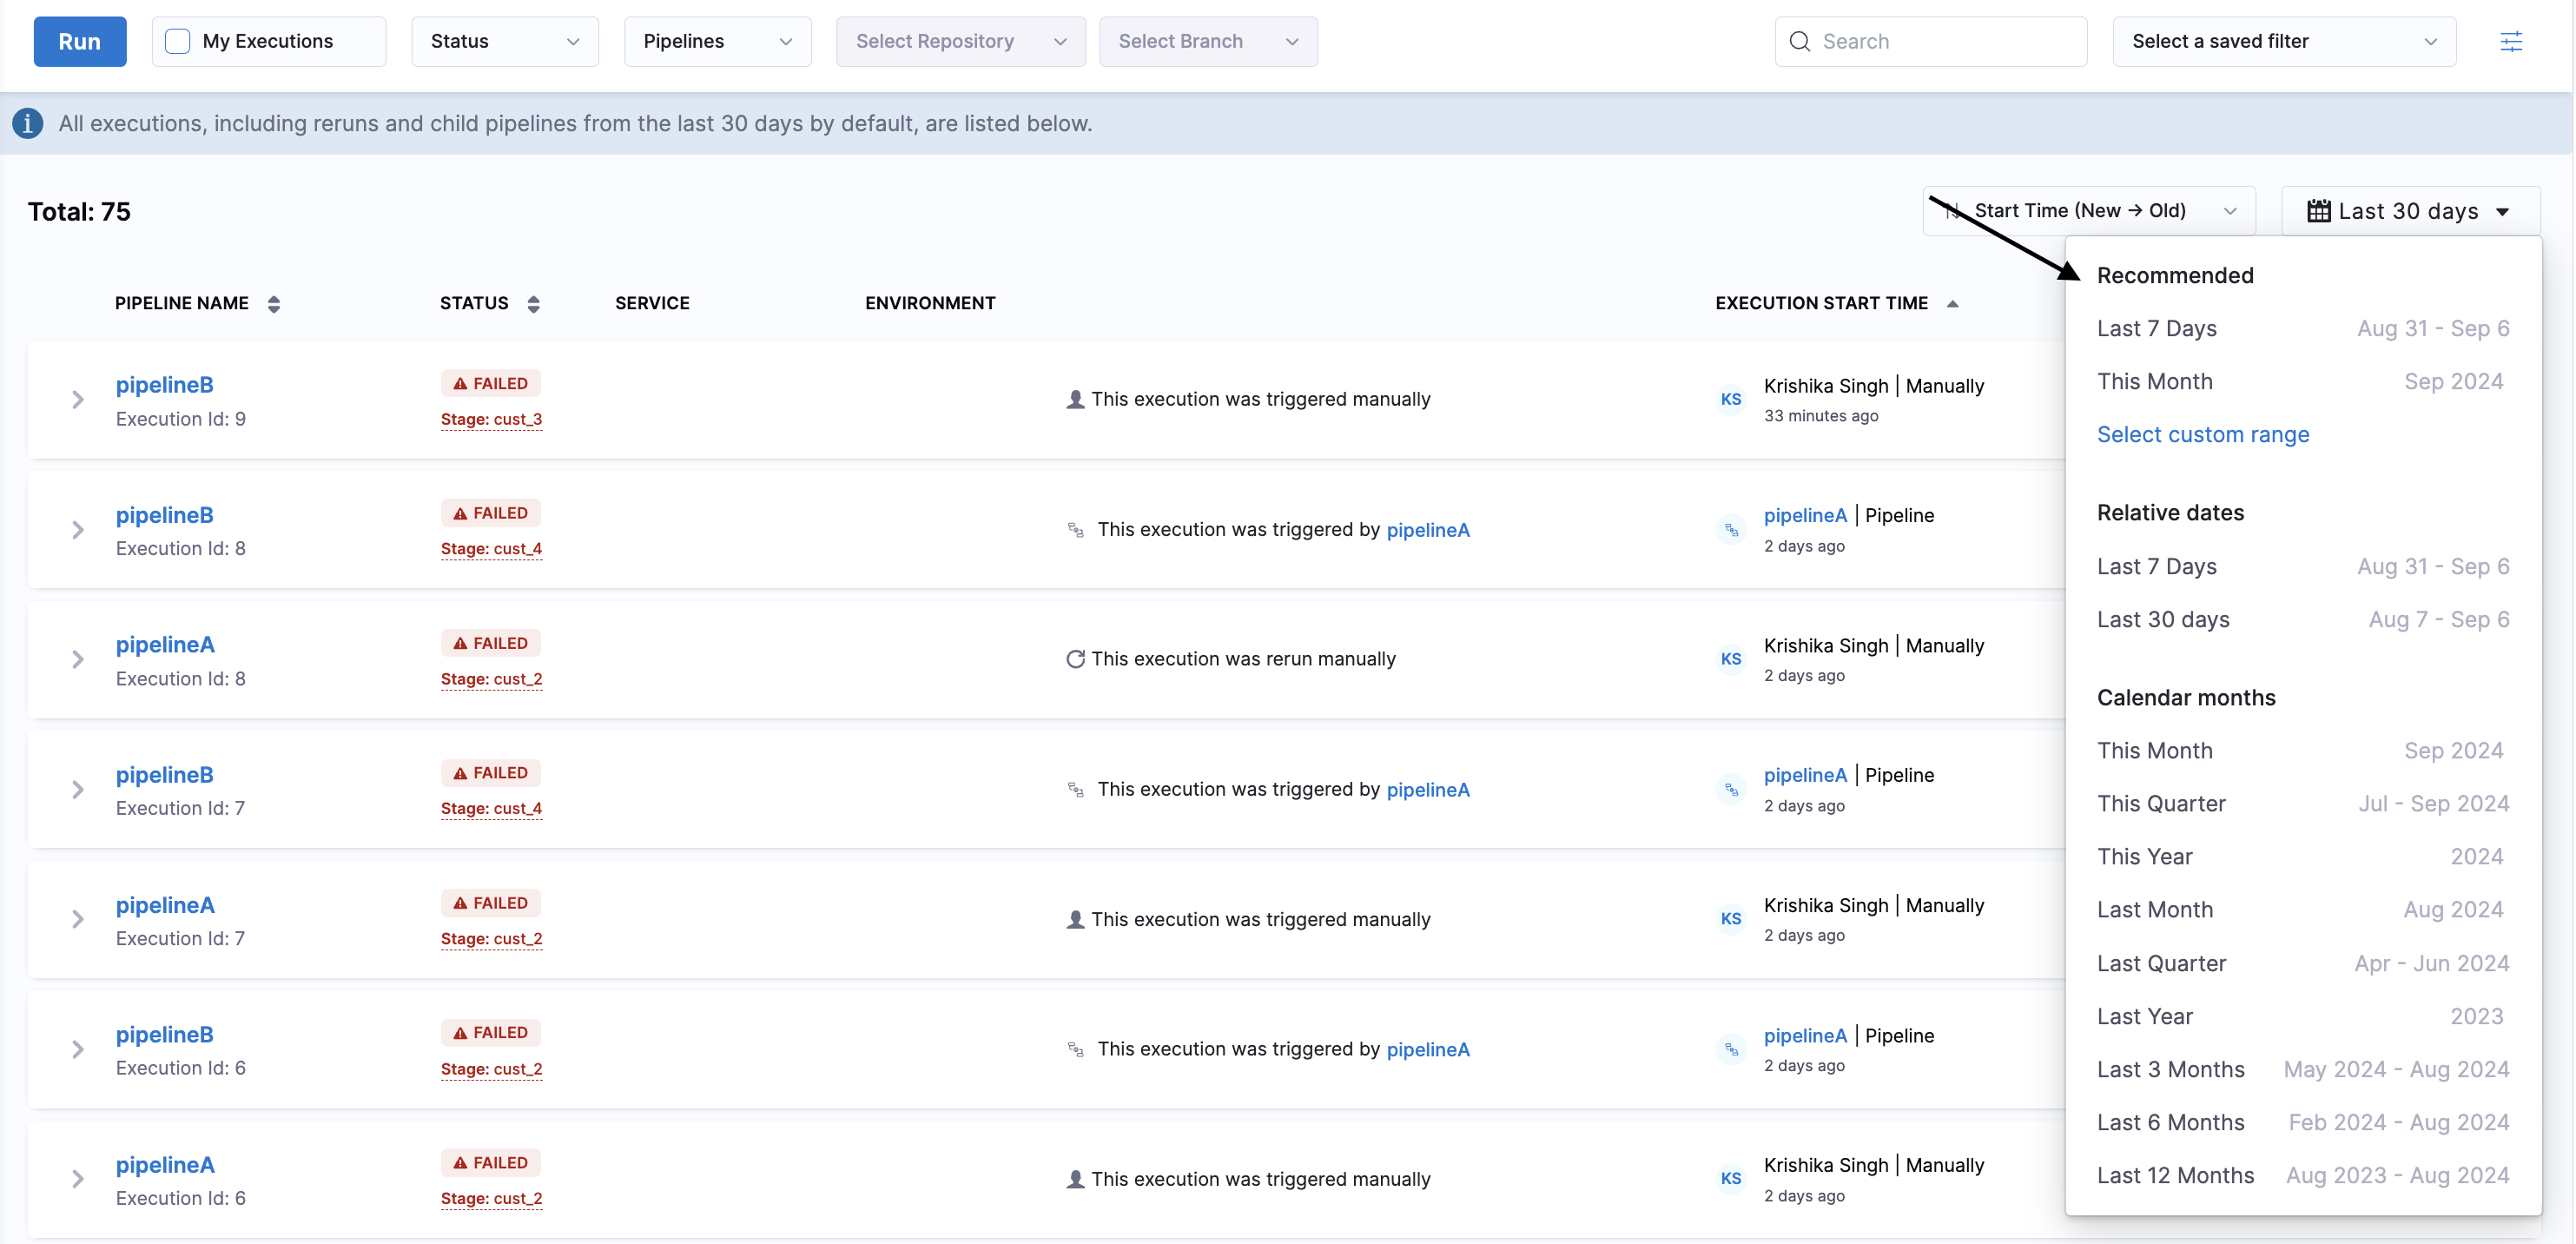
By default, all executions, including re-runs and child pipelines from the last 30 days, will be listed in the execution view. If you want to view executions beyond 30 days, you can use the filter option available on the Execution page to select a custom time range.
Pipeline execution data is retained for a maximum of 6 months. If you apply a filter to view executions within the last 6 months, the data will be accessible. However, any data older than 6 months will no longer be available.
Execution mode
Filter pipeline execution based on Execution mode:-
- Default: It shows the latest executions(of any retry) and normal execution(without retries) and rollbacks.
- All: It lists the old retries as well for the retried executions along with the default ones.
- Rollback: It only lists those executions which were executed in the rollback mode.
You can also reference execution mode in your pipeline using the expression <+pipeline.executionMode>. For more information, refer to Pipeline expressions
Trigger type
Filter pipeline execution based on type of trigger.
It includes:
- MANUAL
- WEBHOOK
- WEBHOOK_CUSTOM
- SCHEDULE_CRON
- ARTIFACT
- MANIFEST
Trigger identifier
You can mention trigger identifiers to filter pipeline execution triggered by a particular trigger.
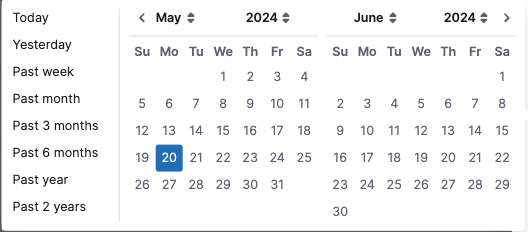
Timeframe
Filter pipeline execution based on time.
Deployment type
Filter pipeline execution based on the deployment type used in the pipeline.
It includes:
- Kubernetes
- Native Helm
- SSH
- WinRM
- Serverless Lambda
- Azure Web Apps
- Deployment Templates
- Amazon ECS
- Spot Elasticgroup
- Tanzu Application Service
- AWS Lambda
- AWS Sam
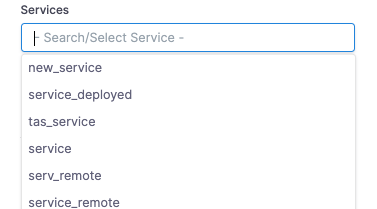
Services
You can filter the pipeline execution based on deployed services. Select your services from the drop-down list.
Environments
You can filter pipeline execution based on the environment to which you have deployed your service.
Artifacts
Filter pipeline execution based on artifacts.
Build type
Filter pipeline execution based on Build Type.
It includes:
- Pull Request/Merge Request
- Branch
- Tag
Execution Summary API
Harness provides an API to retrieve a summary of pipeline executions:
Sample cURL Command:
curl --location 'https://app.harness.io/gateway/pipeline/api/pipelines/execution/summary?routingId=vpCkHKsDSxK9_KYfjCTMKA&accountIdentifier=vpCkHKsDSxK9_KYfjCTMKA&projectIdentifier=<your-project-id>&orgIdentifier=<your-org-id>&pipelineIdentifier=<your-pipeline-id>global&page=0&size=20&sort=startTs%2CDESC&myDeployments=false&searchTerm=' \
--header 'Authorization: Bearer <your-auth-token>' \
--header 'Content-Type: application/json' \
--data '{"filterType":"PipelineExecution","myDeployments":false,"timeRange":{"timeRangeFilterType":"LAST_30_DAYS"},"moduleProperties":{"ci":{},"cd":{}}}'
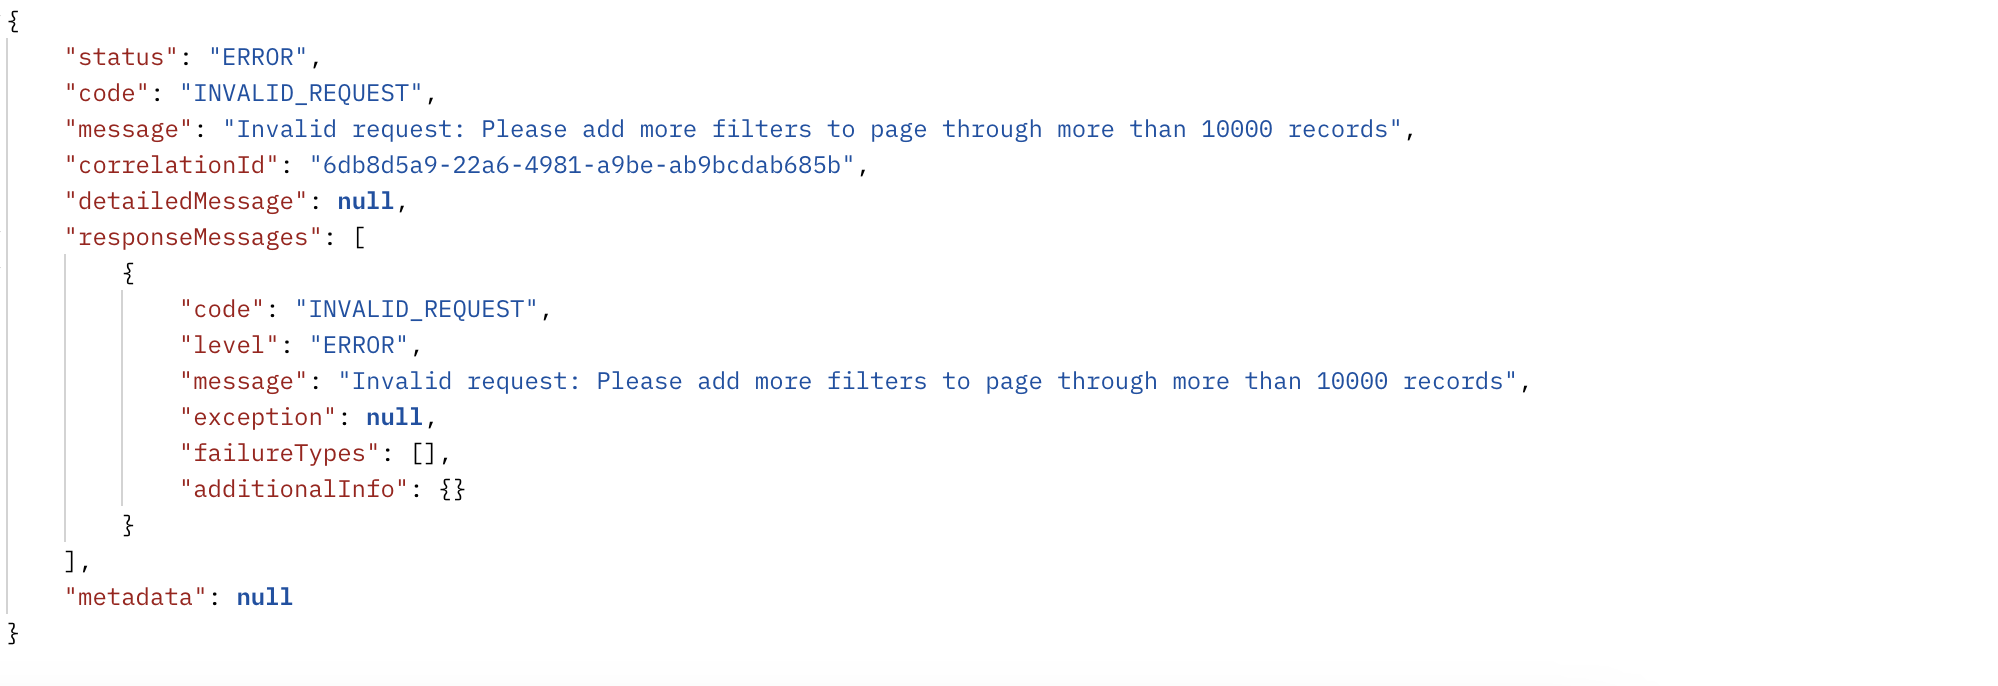
Result Limitations:
Due to the underlying technical implementation, the API cannot retrieve records beyond the 10,000th execution, even if the page size is increased. If the results exceed this limit, an error will be encountered.
If this limitation is encountered, an error message will appear. Below is an example screenshot of the error message to help you identify the issue:
Solution:
To avoid encountering this limitation:
Apply additional filters, such as Status and Time Range, to narrow down the result set and reduce the number of executions listed. Refer to the Pipeline Execution API for more details. As an alternate, you can use the Pipeline Execution Outline API.