View all issues - Security Testing Dashboard
To open the Security Testing Dashboard, open the view selector (top left in the Harness workspace). Select Dashboards and then Security Testing. This dashboard enables you to view, navigate, discover, and investigate detected vulnerabilities in your organization.
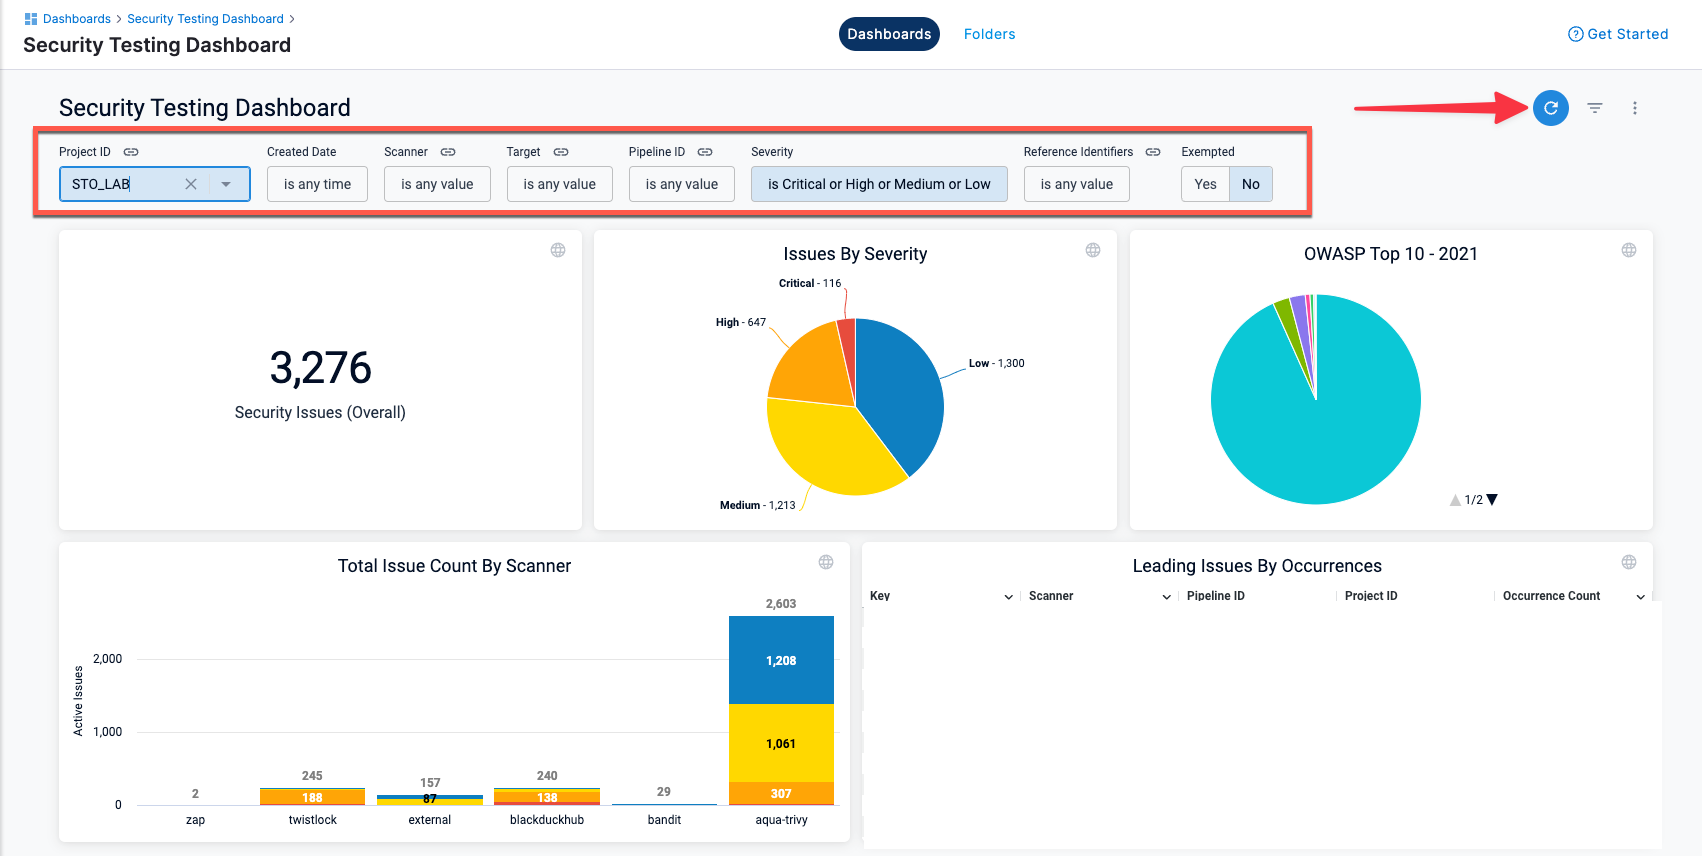
This dashboard includes a set of filters for drilling down into specific issues by project, creation date, scanner, target, pipeline, severity, and so on. You can drill down to a set of relevant issues and then click on a pie slice, chart element, or other UI element to view details on the relevant issues.
You can view the following information in this dashboard:
- Total unique targets, vulnerable targets, total issues, and issues by severity
- Total issue count by scanner
- Issue Overview table
- Leading Issues by Occurrences table
- Open issues over time
- New issue detections over time
- Remediations over time. An issue has a status of Remediated if it was found in the baseline but not the scanned variant.
-
This dashboard requires an Enterprise account.
-
This dashboard shows only results for targets that have baselines defined. You should define a baseline for every target in your project.
-
You must click Update (top right) to apply the filter after you configure it.
-
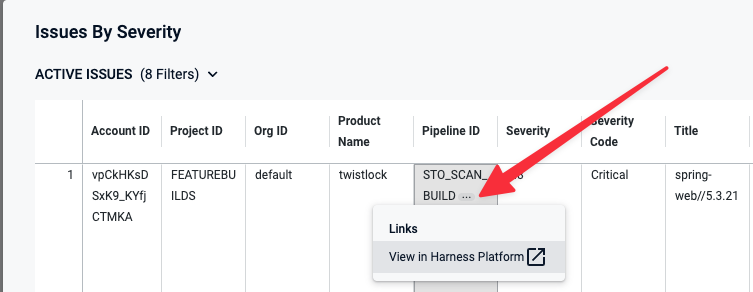
To view details for an issue from the search results, click the pipeline name or ID and choose View in Harness Platform.