Business Alignment report
The Business Alignment Report helps you visualize where your teams are investing the majority of their effort and assist them in prioritizing their time effectively. This report displays your investment efforts across the categories outlined in the corresponding Business Alignment Profile.
The Business Alignment report feature is currently in BETA. Contact Harness Support to enable this feature.
The report displays the effort invested for each category as a percentage, along with a label (Ideal, Poor, Acceptable) on the Pie Chart. The Trend Section displays the breakdown of the score over time in a Stacked Bar Chart format, based on the defined Categories and their associated Allocation Goals in the Business Alignment Profile. The Bar Chart breaks down the metric value into time intervals as configured under the widget settings.

Calculation Parameters
- Effort Allocation: The calculated percentage of effort allocated to a specific contributor and investment category within the chosen effort unit (e.g., ticket count, story points, or ticket time spent). It indicates how the effort is distributed.
- Users may choose the desired effort unit at the widget level, such as Ticket Count, Story Points, or Ticket Time Spent. These units represent different ways of quantifying workload:
- Ticket count: Represents the total number of tickets worked on.
- Story points: Refers to the sum of all assigned story points.
- Ticket time spent: Indicates the amount of time spent on tickets while they remain in the
In Progressstatus category.
The report supports two drill-down views:
- Drill down by Contributors
- Drill down by Tickets
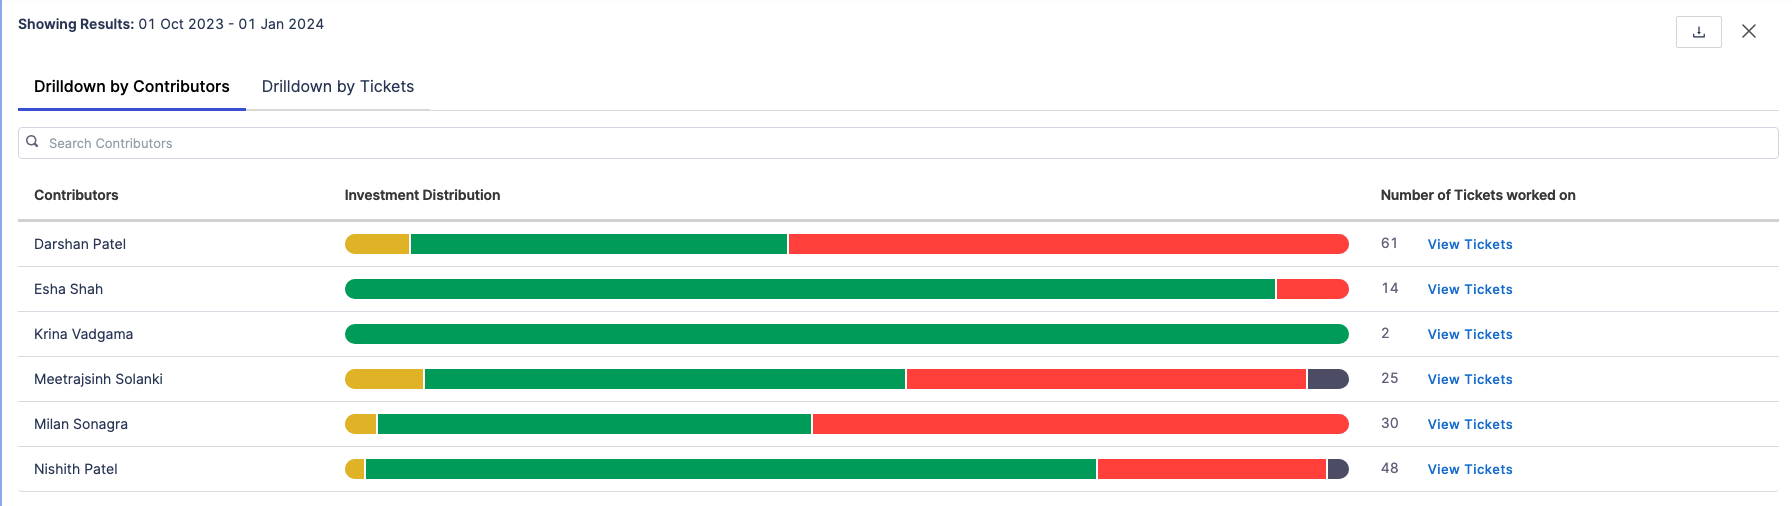
Drill down by Contributors
Displays the total completed effort and distribution among individual contributors across all categories or the selected one. By selecting a category from the Stacked Bar Chart, you can access the drill-down report displaying data on the total completed effort, including the distribution of effort among individual contributors.
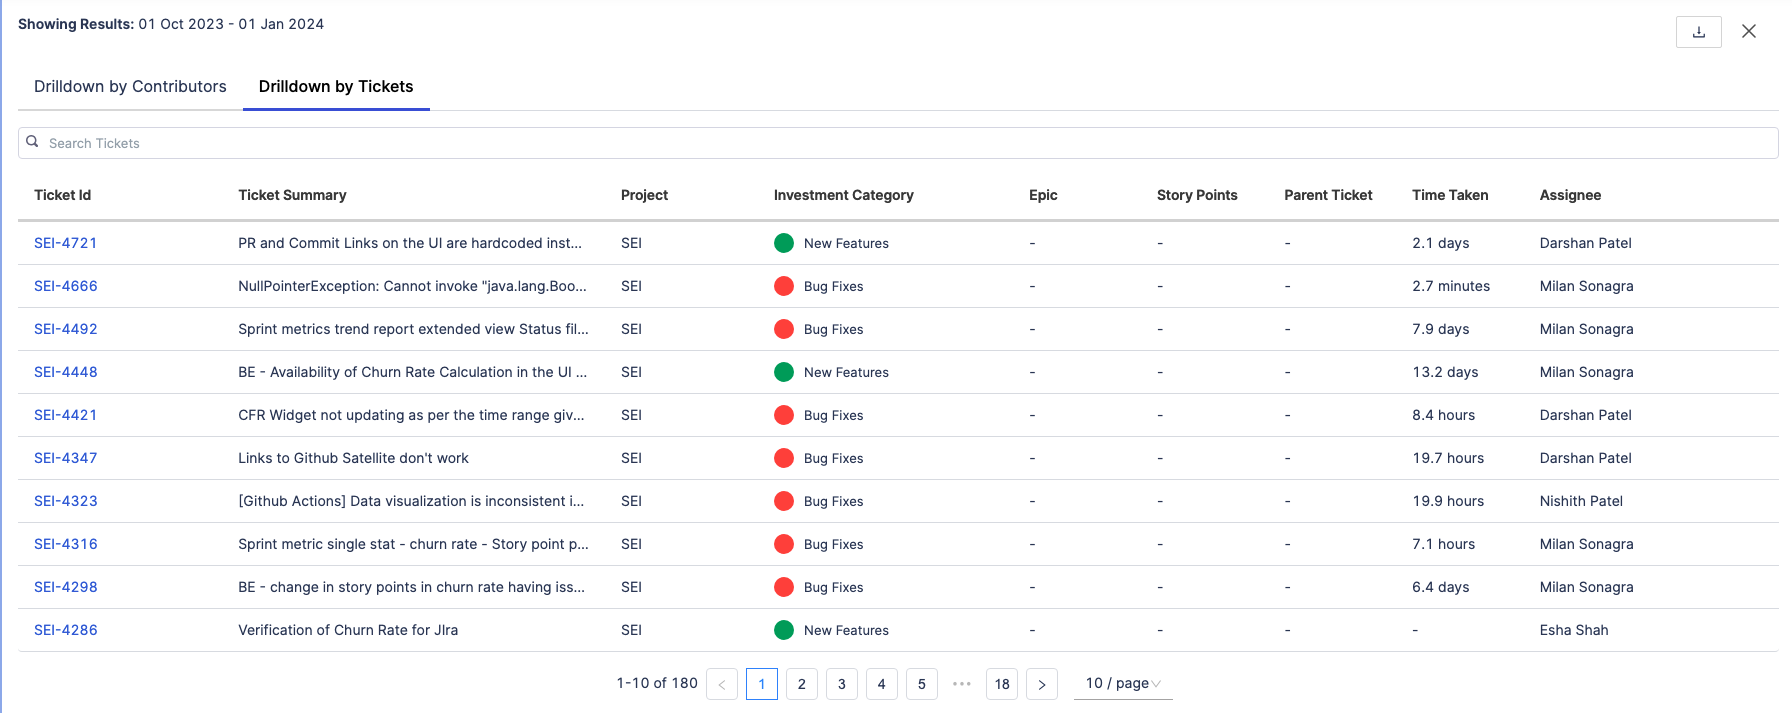
Drill down by Tickets
Shows the relevant tickets included in the selected category or time interval in a tabular format. When viewing the selected category on the Bar Chart, the widget will show data for all the relevant tickets included in the selected category. Alternatively, when a particular interval is selected from the Bar Chart, the widget will display the data for items across all categories during the selected time interval.
The data is represented in tabular format. Both the drill-down options support searching for specific contributors or tickets.
Please note that the Drilldown by Contributor option is available only if the widget is configured to calculate effort by engineer (FTE).
Add the report
Step 1: Add the widget
-
Go to the Insight where you want to add the widget. Make sure you are in the correct project.
-
Select Settings, and then select Add Widget.
-
Select the Business Alignment Report widget.
Step 2: Configure the Filters on the widget
-
Define the Issue Resolved In filter as either in
relativeorabsolutetime frame. You can also enable the Use Insight Time option to consider the data as per the active date configured on the Insight. -
You can add more conditions to specify what data feeds into the widget by creating inclusive and exclusive filters (For example: Project etc)
-
If you include multiple filters, they are inherently combined with an
ANDoperator.
Step 3: Configure the widget settings
-
Select the Business Alignment Profile that you want to use in the metric calculation for the widget.
-
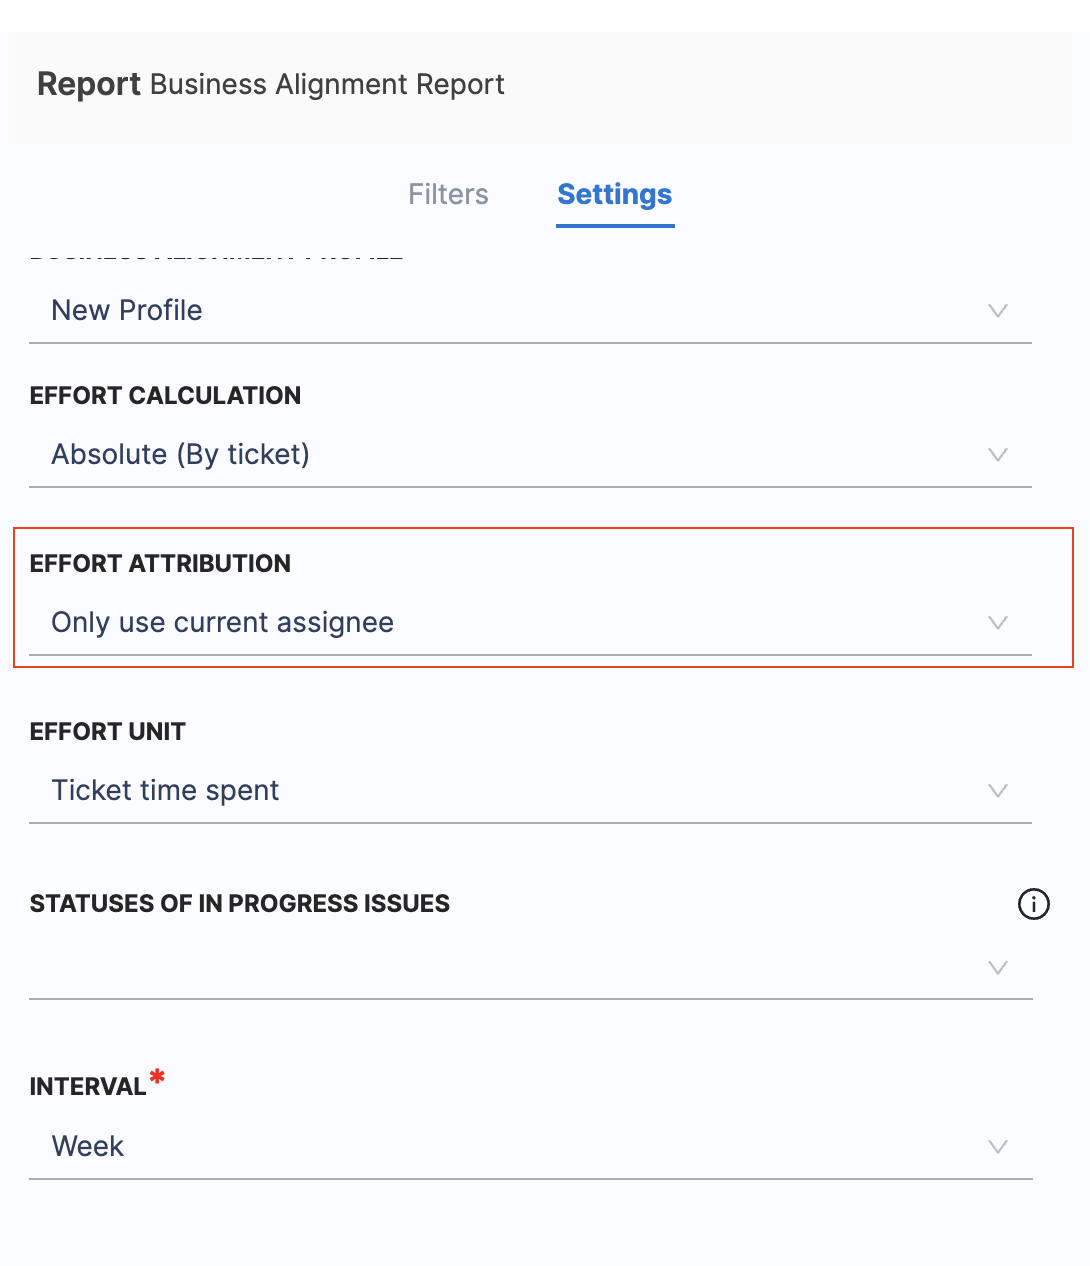
Select the Effort Attribution as either Only use current assignee or Use current and previous assignee
- Only use current assignee: This option considers only the current assignee of a ticket when calculating effort.
- Use current and previous assignee: This option considers both the current and previous assignees of a ticket when calculating effort.
-
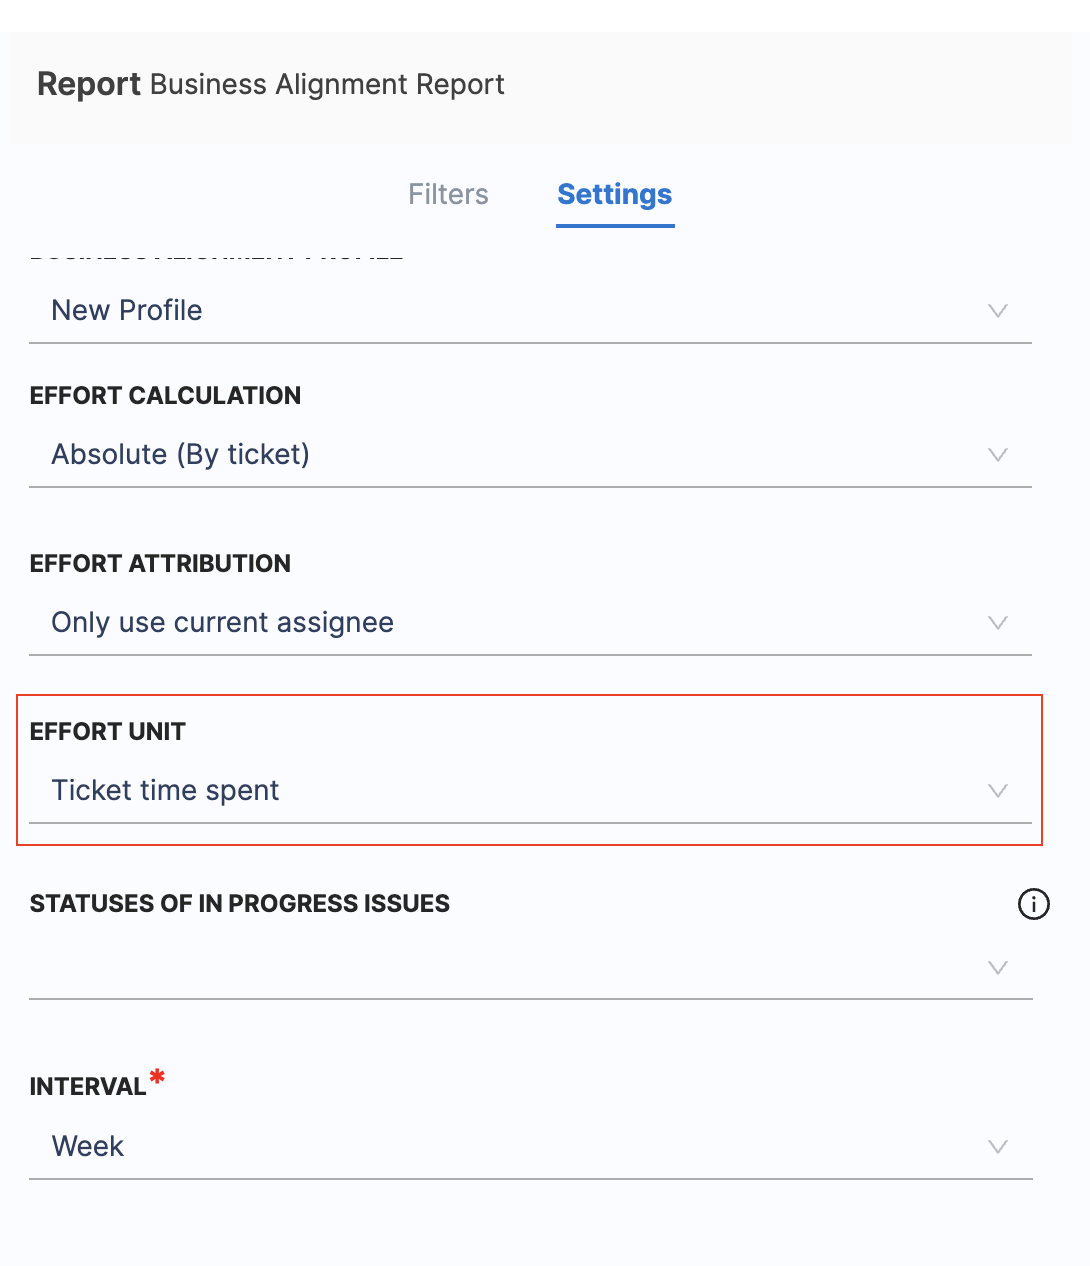
Select the Effort Unit as either Ticket count, Story points or Ticket time spent. This essentially defines how you want to calculate the effort for your alignment metric calculations.
- Ticket count: The effort is calculated based on the number of tickets worked on.
- Story points: The effort is calculated based on the sum of story points assigned to the tickets.
- Ticket time spent: The effort is calculated based on the amount of time spent on tickets while they were in the In Progress status category.
-
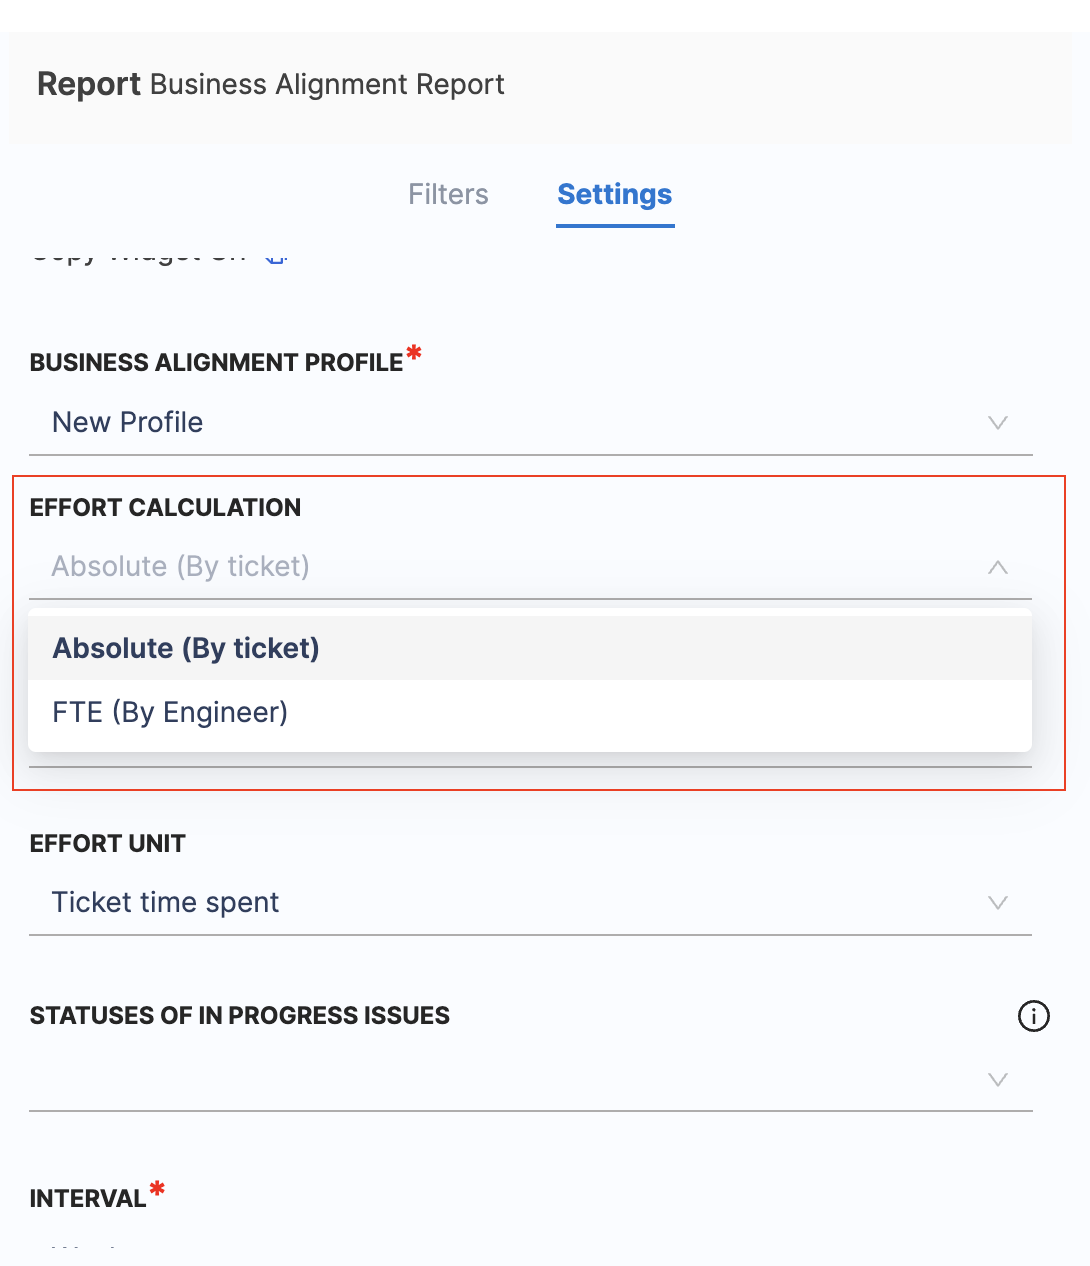
Select the Effort Calculation as either Absolute (By ticket) or FTE (By engineer).
- Absolute (By Ticket): This considers the total number of tickets assigned within a specific category.
- FTE (By Engineer): This option considers the relative effort invested by the engineer across all the tickets that belong to different categories.
If the engineer has worked on 5 tickets, belonging to 3 different categories, their effort is distributed across the 3 categories based on the Effort Unit and Effort Attribution selected.
- Select the interval for the widget to display the data. This option allows you to choose the time interval for which the widget should display the data, such as Weekly, Bi-weekly, Monthly or Quarterly.
Step 4: Save the widget
Complete the widget settings and select Next: Place Widget, place the widget on Insight and then select Save Layout.
Business Alignment Report Use Cases
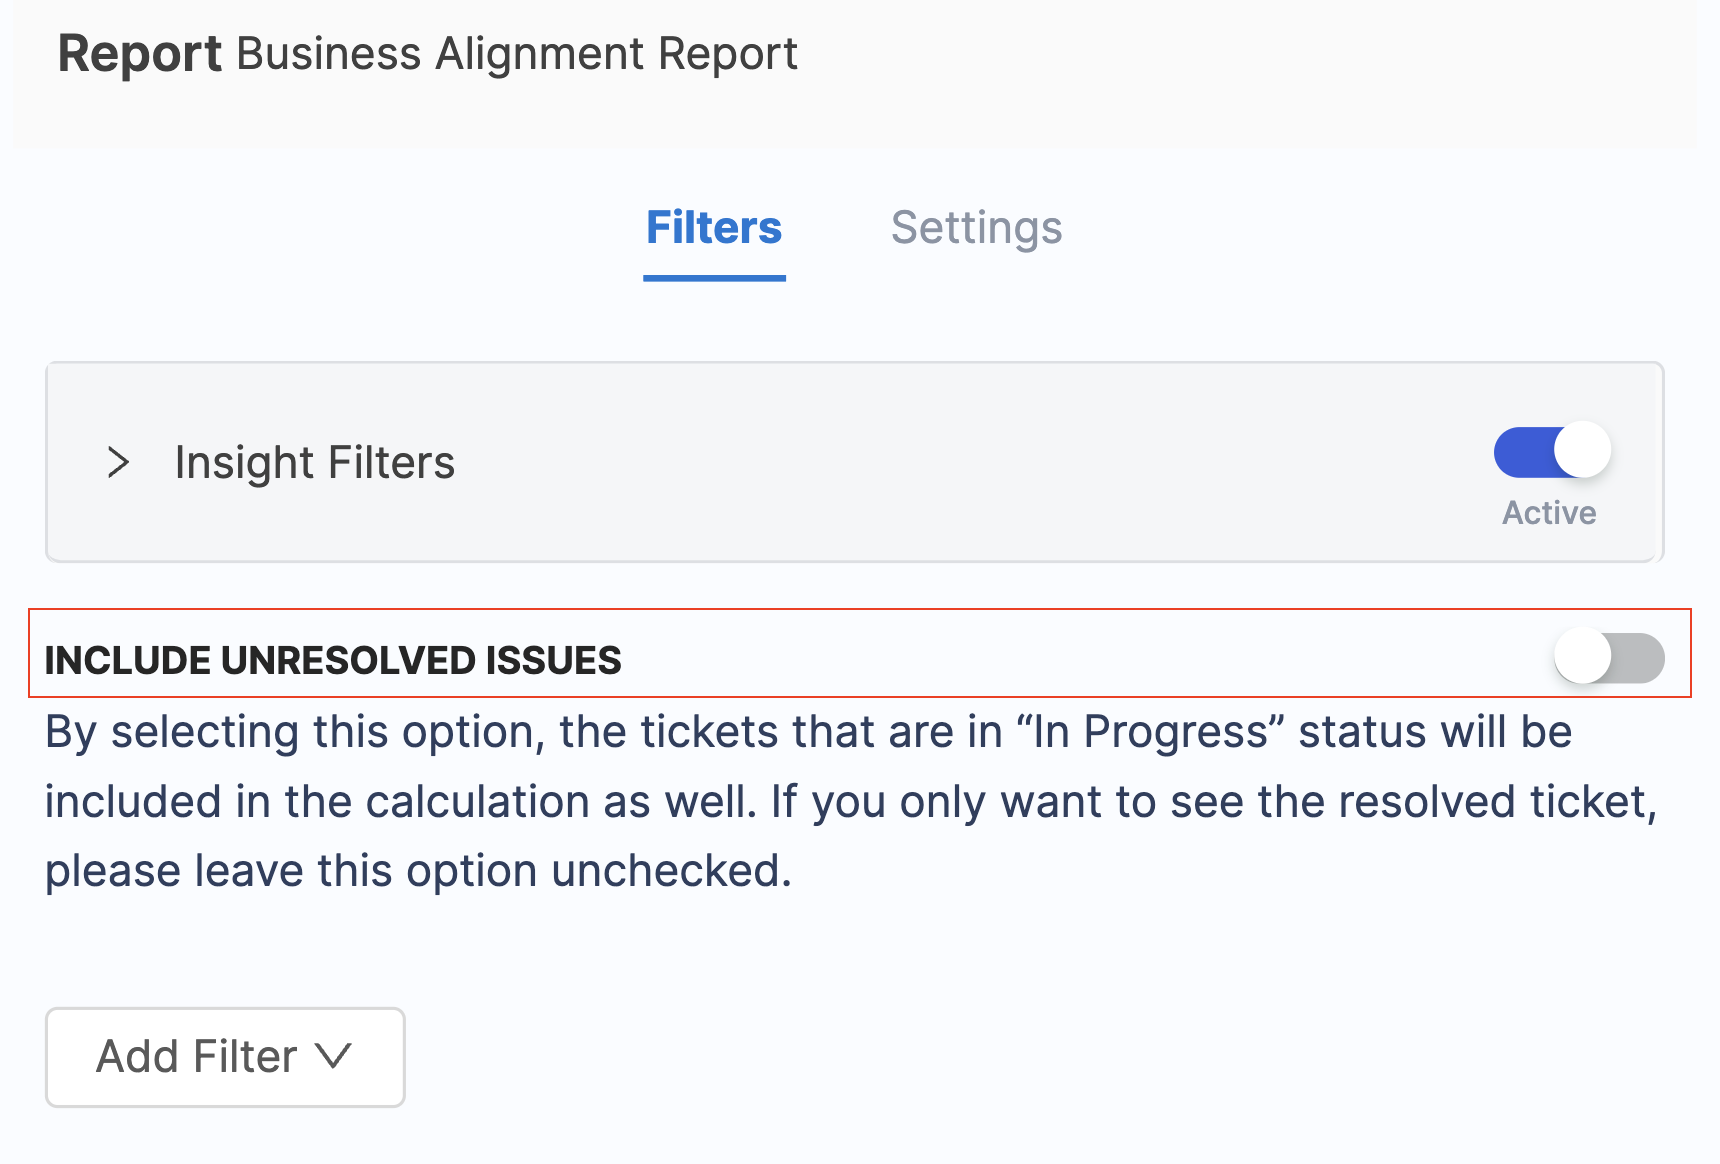
Measure the actual effort invested for a specific time period (BETA)
The Business Alignment report can be used to calculate alignment metrics for tickets that are in the In Progress status category and those that have been resolved (i.e., Done status category) within a specific duration of time. This helps you analyze the effort invested in both ongoing and completed work within a specific time frame.
This feature is behind the Feature Flag <NEW_BA_COMBINED_WIDGET> and <BA_INCLUDE_UNRESOLVED_ISSUES> . Please contact Harness Support to enable this feature.
Step 1: Add the Business Alignment report
-
Select Settings, and then select Add Widget.
-
Select the Business Alignment Report widget.
Step 2: Configure the report filters to measure the active effort investment
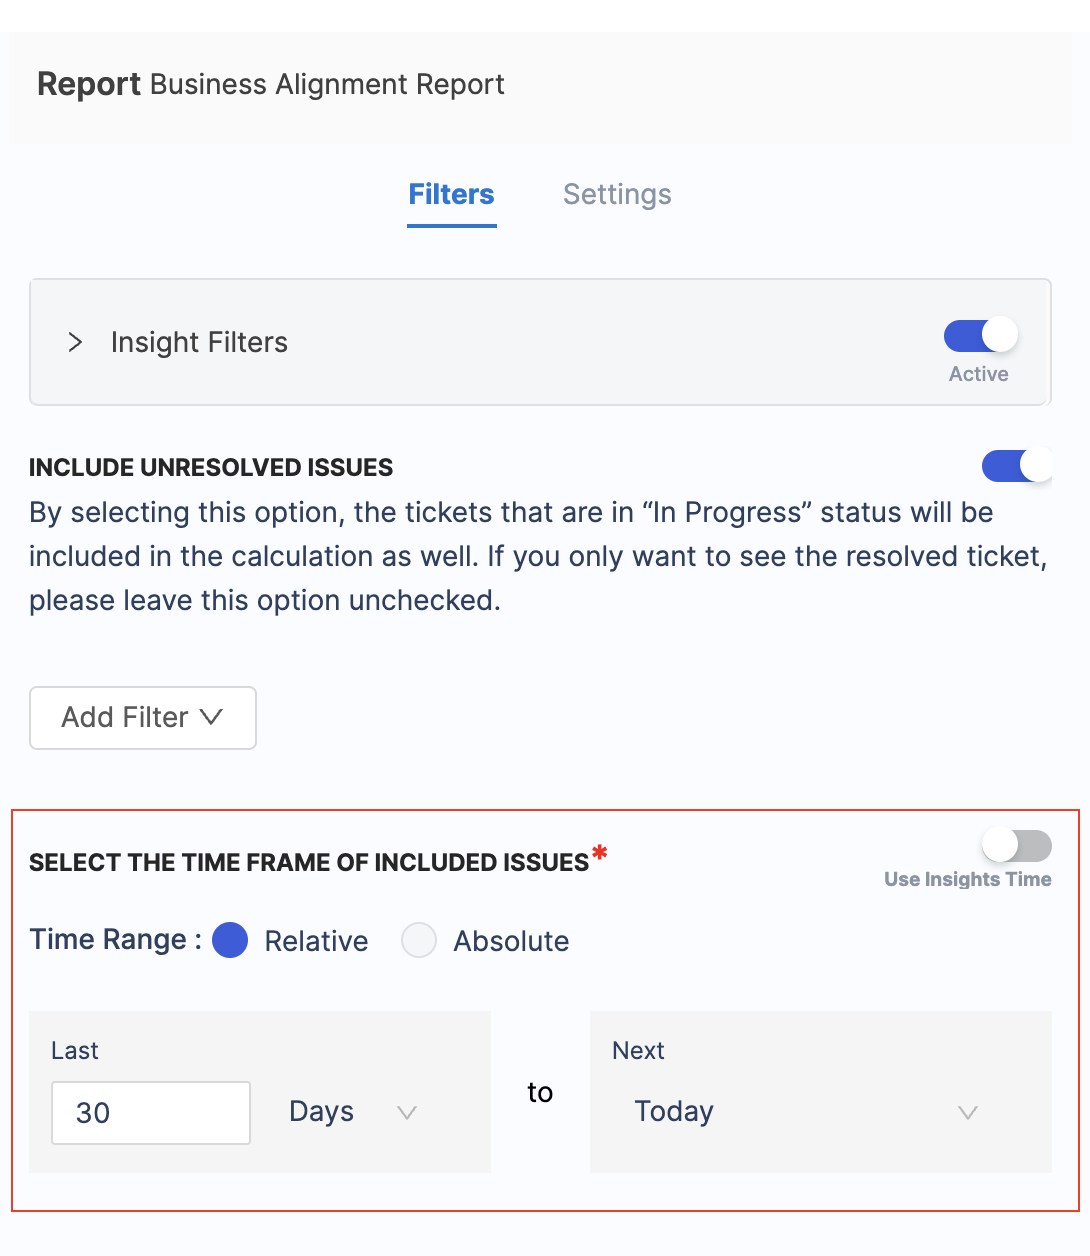
- Under the Filters tab, enable the Include Unresolved Issues option. By selecting this option, tickets that are in the In Progress status category will be included in the metric calculation. If you only want to include only resolved tickets, leave this option unchecked.
- Specify the time period or date range for which you want to include tickets in the calculation and display within the widget.
Step 3: Configure the report settings
-
Select the Business Alignment Profile that you want to use in the metric calculation for the widget.
-
The Effort Attribution will automatically be selected as Only use current assignee
- In this case, Ticket Time Spent is the only supported Effort Unit and not Story Points or Ticket Count.
-
Select the unresolved ticket statuses that represent the In Progress status category, as the report calculates effort based on time spent on tickets in those statuses.
-
The Effort Calculation will automatically be selected as Absolute (By ticket).
- Select the interval for the widget to display the data. This option allows you to choose the time interval for which the widget should display the data, such as Weekly, Bi-weekly, Monthly or Quarterly.
Step 4: Save the report
Complete the widget settings and select Next: Place Widget, place the widget on Insight and then select Save Layout.
Calculation Example
In this example, we have a User X who is part of a team responsible for completing tasks in two different categories: Category A and Category B. These categories represent different types of work or projects within the team's scope.
- Category A: Tasks that require significant effort, potentially critical features, or complex technical issues. These tasks demand substantial resources and attention from the team.
- Category B: Tasks requiring comparatively lower effort, such as routine maintenance or minor enhancements. They may have a lower priority compared to Category A tasks.
Absolute Effort Calculation
In this scenario, we're analyzing the contributions of 3 contributors within two categories, Category A and Category B, based on the effort metric of Ticket Counts. The Ticket Counts represent the number of tasks assigned to each developer.
For Category A:
- Total effort by User X: 3 (Ticket Counts)
- Total effort by User Y: 2 (Ticket Counts)
- Total effort by User Z: 1 (Ticket Counts)
Total effort for Category A = 3 + 2 + 1 = 6
The total number of tasks assigned to all team members in Category A provides an understanding of the workload distribution.
For Category B:
- Total effort by User X: 2 (Ticket Counts)
- Total effort by User Y: 2 (Ticket Counts)
- Total effort by User Z: 1 (Ticket Counts)
Total effort for Category B = 2+2+1 = 5
This calculation offers insights into the distribution of tasks in Category B among team members.
Effort metric for Category A = Total effort for Category A/Total effort across all categories * 100
6/6+5 * 100 = 54.55%
Effort metric for Category B = Total effort for Category B/Total effort across all categories * 100
5/6+5 * 100 = 45.45%
FTE Effort Calculation
FTE effort allows for a standardized assessment of individual contributions by considering the proportion of each developer's workload.
For Category A:
- Total FTE effort by User X: 0.6
- Total FTE effort by User Y: 0.5
- Total FTE effort by User Z: 0.5
Total FTE Effort for Category A = 0.6 + 0.5 + 0.5 = 1.6
For Category B:
- Total FTE effort by User X: 0.4
- Total FTE effort by User Y: 0.5
- Total FTE effort by User Z: 0.5
Total FTE Effort for Category B = 0.4 + 0.5 + 0.5 = 1.4
Here we convert the Absolute Effort (Ticket Counts) into FTE effort by considering the proportion of each developer's workload. This helps in understanding the relative contribution of each developer in terms of full-time work.
Calculation of User X's Contribution
User contribution represents the percentage of tasks handled by each contributor within specific categories, aiding in assessing their involvement and impact.
For Category A:
- User X's contribution = Total effort by User X in Category A / Total effort by User X * 100
- User X's total effort in Category A = 3 (Ticket Counts)
User X's contribution to Category A = 3/5 * 100 = 60%
For Category B:
- User X's contribution = Total effort by User X in Category B / Total effort by User X * 100
- User X's total effort in Category B = 2 (Ticket Counts)
User X's contribution to Category B = 2/5 * 100 = 40%
To summarize the effort calculation for User X:
- User X's contribution to Category A: 60%
- User X's contribution to Category B: 40%
User X's contribution percentage is determined by dividing their total effort (Ticket Counts) within each category by the total effort by User X across all categories. This percentage showcases User X's share of tasks within the total workload of each category.
These insights help in understanding User X's workload distribution and their impact on different categories based on the chosen effort metric (Ticket Counts).