Hygiene reports
Use hygiene reports to understand hygiene in your issue management and support systems, such as Jira or Zendesk. Hygiene measures adherence to issue management best practices, such as issue classification and responsiveness, based on hygiene categories. Hygiene reports can help you measure overall process adherence and identify gaps in issues that resulted in delayed deployments.
Popular Hygiene Reports
The following are the most commonly used Hygiene reports.
Issue Hygiene report
You can measure sprint hygiene scores with the Issue Hygiene Report and the Issue Hygiene Trend Report.
The Issue Hygiene Report shows your overall hygiene score and individual scores for each hygiene category. Scores represent hygiene misses in the designated time frame. A hygiene miss means that a ticket in your issue management system was missing an important field, failed to change status in a timely manner, or was assigned to an inactive user.
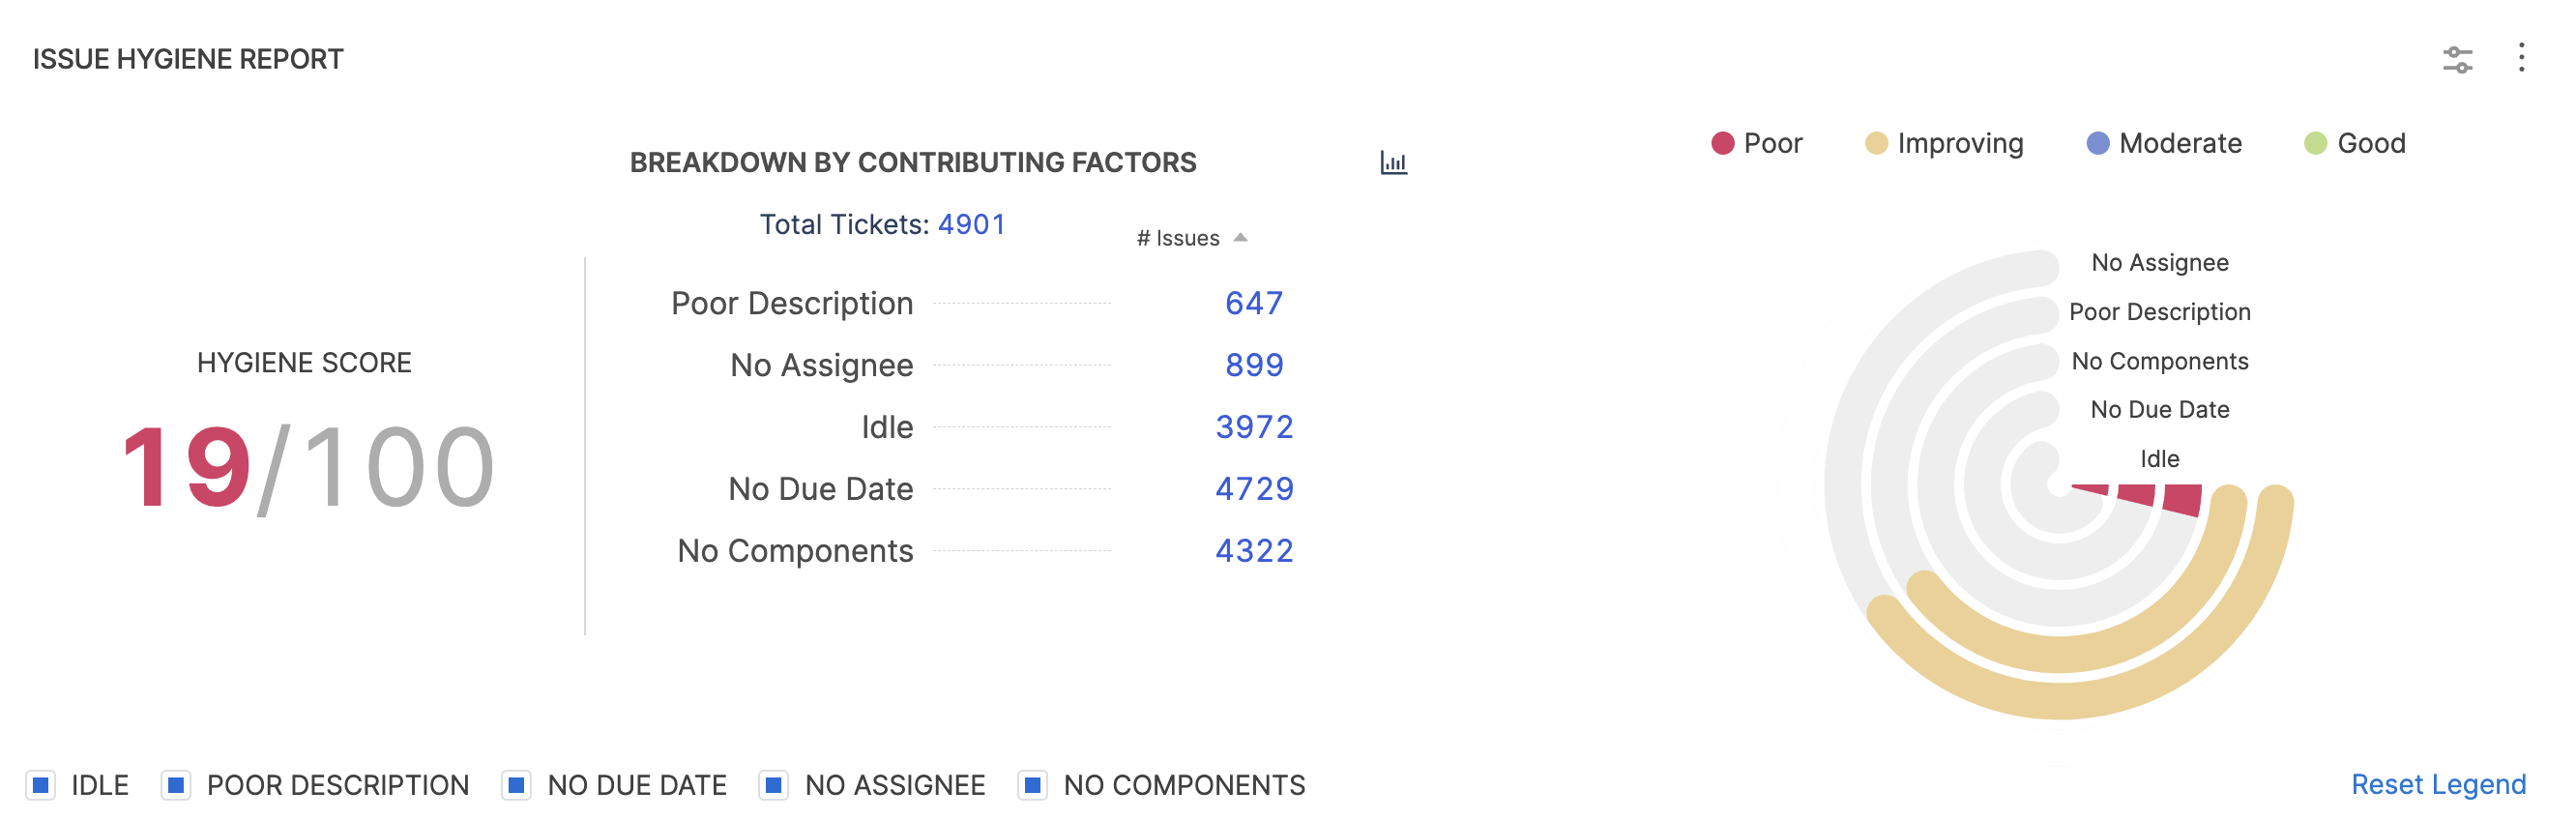
Overall Hygiene Score
Each hygiene miss is tallied against a score of 100. A score of 100 indicates that no tickets were submitted with missing hygiene points.
The Overall Hygiene Score gives you a comprehensive view of the health of your issue management system. This score represents the percentage of tickets that meet your defined hygiene standards. A higher score indicates better issue hygiene, with a score of 100 meaning that no tickets were missing any important hygiene data.
The Overall Hygiene Score is calculated as follows:
Category Score = (Number of Tickets Missing Hygiene / Total Number of Tickets) * Category Weight

Total Hygiene Score = Sum of Category Scores
You can use the Issue Hygiene Trend Report to analyze changes in hygiene scores over time.
Issue Hygiene Category Scores
Hygiene misses are based on hygiene categories. The built-in categories are:
- Idle: The ticket had no activity for a certain period of time.
- Poor Description: The Description field was empty or contained little content.
- No Due Date: The ticket had no due date populated.
- No Assignee: The ticket had no assignee populated.
- No Components: The Components field was empty.
- Missed Response Time: The ticket failed to change status before the goal response time expired.
- Missed Resolution Time: The ticket wasn't in a resolved status before the goal resolution time expired.
- Inactive Assignees: The ticket was assigned to an inactive user.
Data for hygiene categories are derived from your integrations.
You can add custom hygiene categories by configuring Custom Hygiene Misses in your issue management SEI integrations. You can have up to ten categories.
You can modify the importance of each category when you configure the Issue Hygiene Report.
Add the report
To configure the Issue Hygiene report, follow these steps:
Step 1: Add the widget
- Go to the Insight where you want to add the widget, select Settings, and select Add Widget.
- Select the Issue Hygiene Report widget.
Step 2: Configure the Filters on the widget
Configure the widget's Filters. Filters can be blank or filtered down to a desired ticket type or time frame. If you include multiple filters, they are inherently combined with an AND operator.
EARLY ACCESS FEATURE
The ability to select specific sprints or the current sprint at the widget level is currently in BETA. Contact Harness Support to enable this feature.
When the Feature Flag is enabled for the SEI module you can:
- Define the criteria for considering sprints under the Filters section. You have two options: you can either include the current sprint or filter by the last sprint.
- You can also manually select the sprints for which you want to configure the widget.
Step 3: Define the Weights for each Hygiene Category
Configure the Weights for each hygiene category.
A lower weight causes a category to have a lower impact on the overall score, and a higher weight causes a category to have a larger impact on the overall score. A weight of zero excludes that category from the hygiene score calculation. Make sure the total of all weights equals 100.
In addition to the built-in categories, you can add custom hygiene categories by configuring Custom Hygiene Misses in your issue management SEI integrations.
Step 4: Configure the Settings
On the Settings tab, select the Issue Management System to use for this widget. Available options are based on your configured SEI integrations.
Step 5: Save the widget
Select Next: Place Widget, place the widget on Insight and then select Save Layout.
The Issue Hygiene Report is often used in conjunction with the Issue Hygiene Trend Report to show a history of hygiene scores.
Issue Hygiene Report use cases
Here are some examples of configurations for the Issue Hygiene Report widget.
Active sprint hygiene
You can configure the widget to show your team's current sprint only. To do this, go to the Filter tab, select Sprint, and then select Includes Active Sprints Only.
Insight time hygiene
Insight time is the time range selected by the user when viewing Insights. You can configure the widget to show the hygiene score for all tickets created in the user-selected Insight time. To do this, go to the Filter tab, select Issue Created In, and then select Use Insight Time.
Issues in progress hygiene
You can configure the widget to show the hygiene score for all in-progress tickets. To do this, go to the Filter tab, select Status, and then select the statuses that correspond to in-progress tickets.
Issues in backlog hygiene
You can configure the widget to show the hygiene score for all tickets in your backlog. To do this, go to the Filter tab, select Status, and then select the statuses that correspond to backlog tickets.
Issue Hygiene Trend report
Definition
The Issue Hygiene Trend report provides a view of the historical performance of your issue management practices. This report displays the trend of individual scores for each hygiene category, allowing you to analyze the evolution of your issue hygiene over time. This report can help you answer questions about your issue hygiene, such as:
- How have your issue classification practices changed over the past few quarters?
- Are there specific hygiene categories where your team's performance has been inconsistent or declining?
- How do your current issue hygiene metrics compare to the targets or benchmarks you've set for your organization?
By understanding these historical trends, you can make informed decisions to optimize your issue management processes and ensure the consistent implementation of effective hygiene practices across your engineering team.
Add the report
To configure the Issue Hygiene Trend report, follow these steps:
Step 1: Add the widget
- Select Settings, then Add Widget.
- Choose the Issue Hygiene Trend report widget.
The following settings are available to configure this report:
Step 2: Configure the Filters for the widget
- Add additional conditions to specify what data feeds into the widget by creating inclusive and exclusive filters.
- If you include multiple filters, they are inherently combined with an
ANDoperator.
Step 3: Define the Weights for each Hygiene Category
Configure the Weights for each hygiene category.
A lower weight causes a category to have a lower impact on the overall score, and a higher weight causes a category to have a larger impact on the overall score. A weight of zero excludes that category from the hygiene score calculation. Make sure the total of all weights equals 100.
In addition to the built-in categories, you can add custom hygiene categories by configuring Custom Hygiene Misses in your issue management SEI integrations.
Step 4: Configure the Settings
- Select the Issue Management System to use for this widget. Available options are based on your configured SEI integrations.
- Select the Time Interval for the data to be displayed in the widget.
- Select how you want to display the data in the widget. The available options are Stacked Area Chart and Stacked Bar Chart
Step 5: Save the widget
Select Next: Place Widget, place the widget on Insight and then select Save Layout.
Support Hygiene reports
Support Hygiene Reports provide valuable insights into the quality and efficiency of your customer support operations. These reports focus on analyzing the hygiene of your support tickets across multiple areas.
-
Support Hygiene Report: This report measures the overall quality of the support backlog based on various hygiene factors or categories, such as:
- Ticket description quality
- Presence of contact information
- Idle time between ticket updates
- Adherence to escalation protocols
- Overall ticket resolution effectiveness
By evaluating support tickets against these hygiene criteria, the report helps identify areas for improvement in your customer support processes.
-
Support Hygiene Trend Report: The Support Hygiene Trend Report allows you to observe changes in support hygiene scores over time. This enables you to:
- Track the impact of process improvements or training initiatives on support quality
- Identify recurring problem areas that require deeper investigation
- Benchmark your support hygiene metrics against organizational targets or industry standards
These support hygiene reports are similar in functionality and configuration to the Issue Hygiene Reports, providing a holistic view of how effectively your organization is delivering high-quality customer support.