Create new dashboard
This section will guide you through creating a new chaos dashboard, and creating custom visualizations for various entities of a chaos experiment.
Before you begin, review the following
Create a new visualization
-
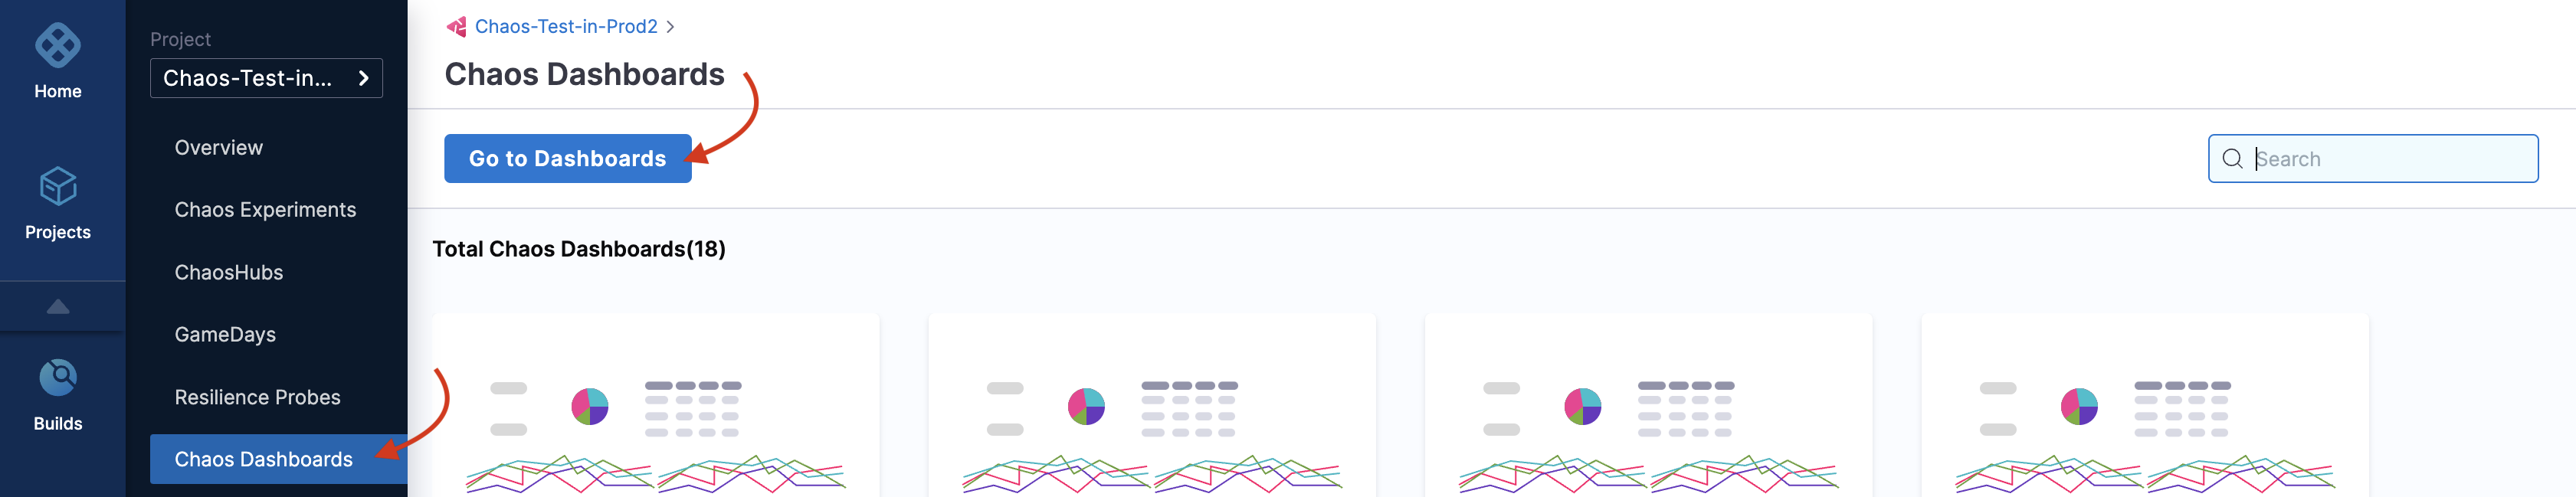
To create a new dashboard, navigate to Chaos Dashboards and select Go to Dashboards.
-
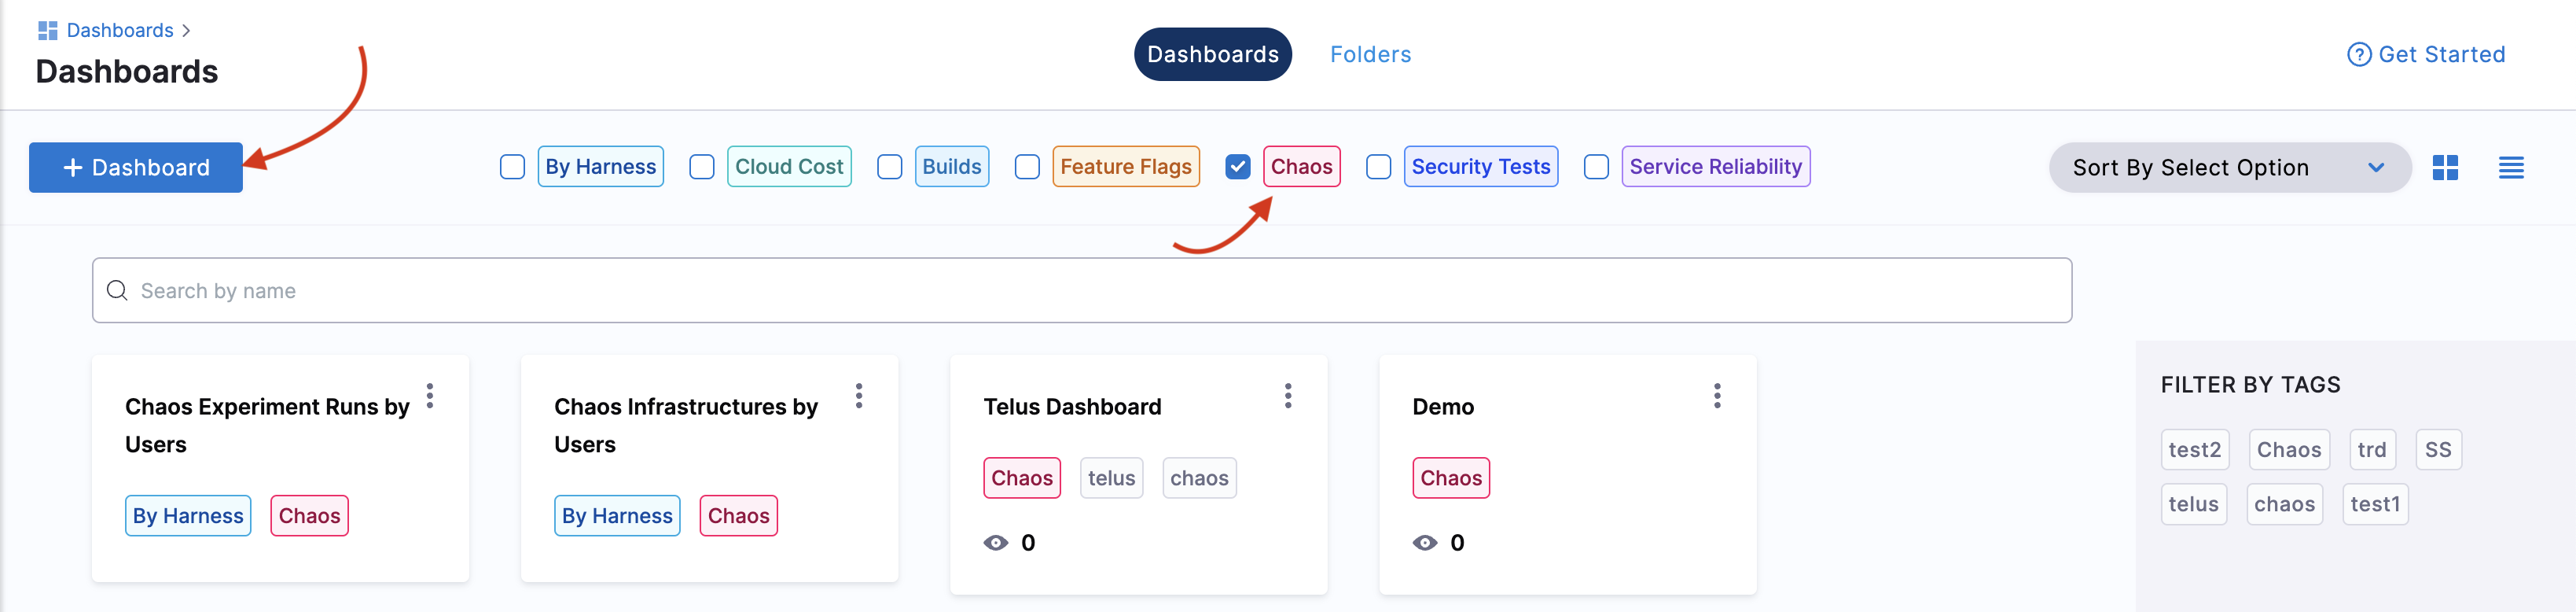
Filter by chaos dashboards, and click + Dashboard .
-
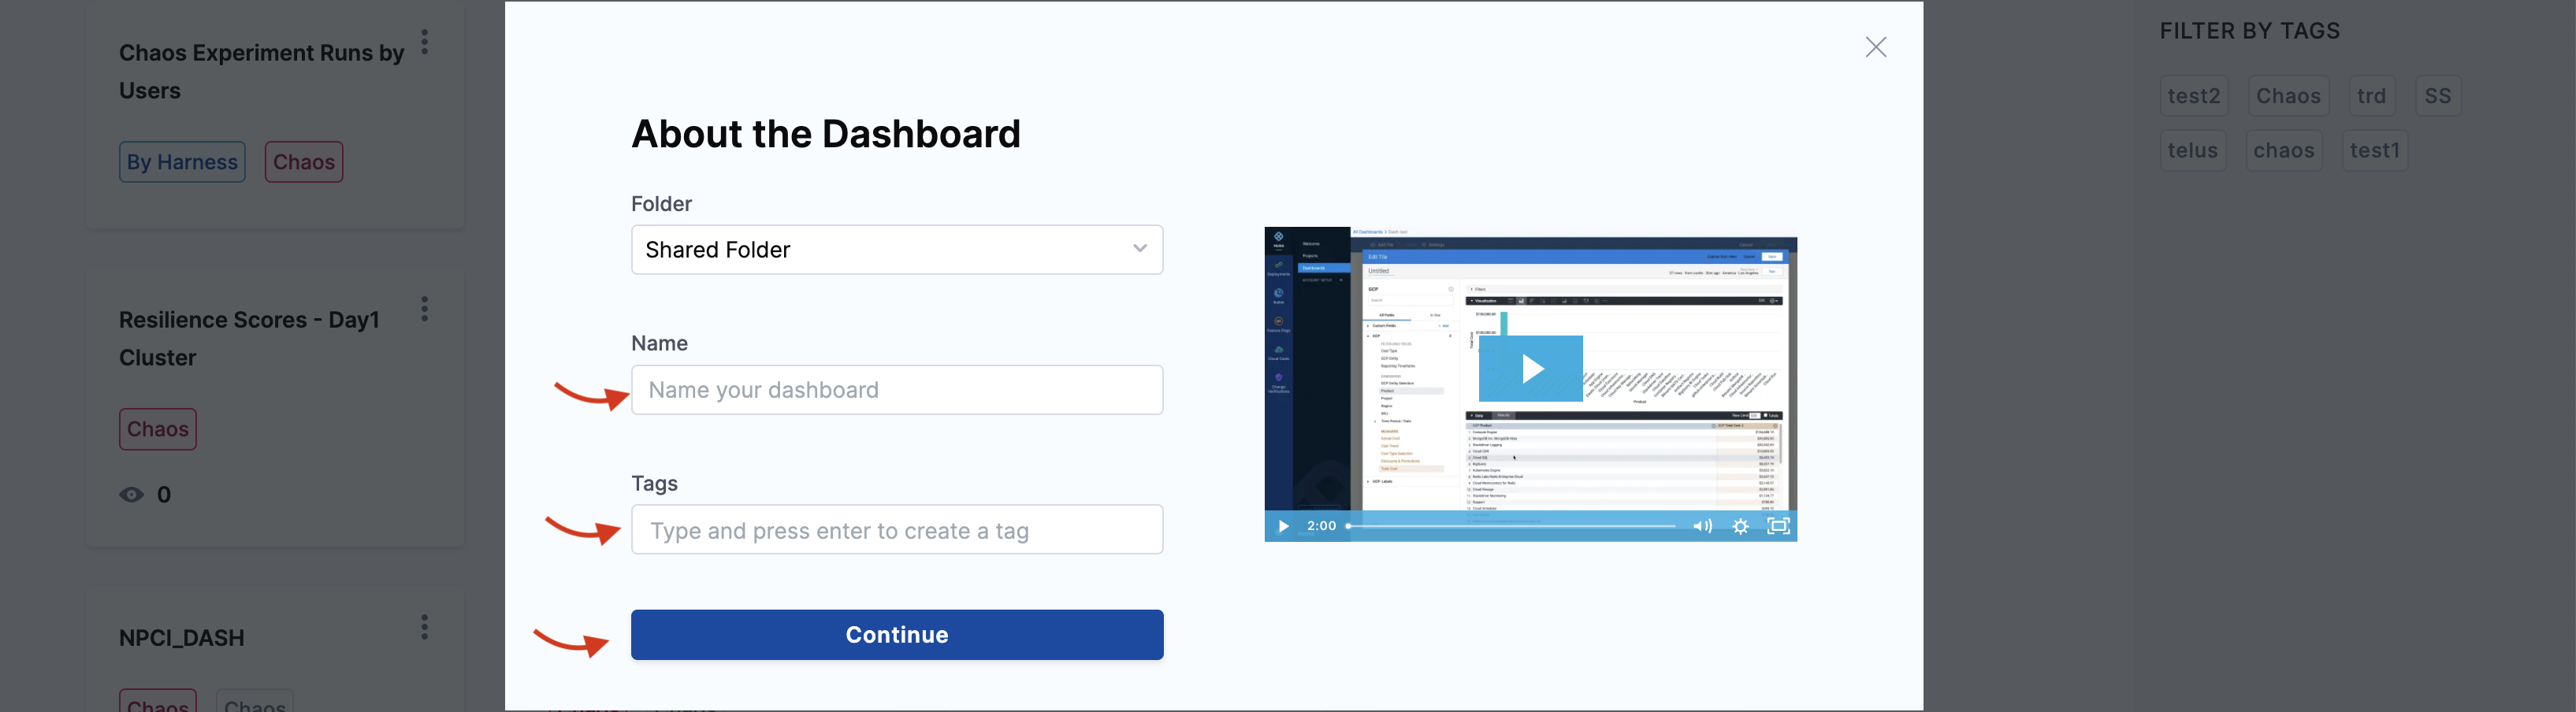
Add values for Folder, Name, and Tags (mandatory). The Tags field is used to filter dashboard by modules, hence it is necessary to provide relevant tags. Click Continue.
-
This creates an empty dashboard. You can add visualizations (also known as panels) by editing this dashboard. Click Edit Dashboard to edit the dashboard that you created in the previous step.

-
Click Add and select Visualization.

-
Select a table whose fields you wish to visualize. Harness CE currently supports Application Maps, Chaos Experiments, Chaos GameDays, Chaos Guard, Chaos Hub, and ** Chaos Probes. In this example, select Chaos Experiments.
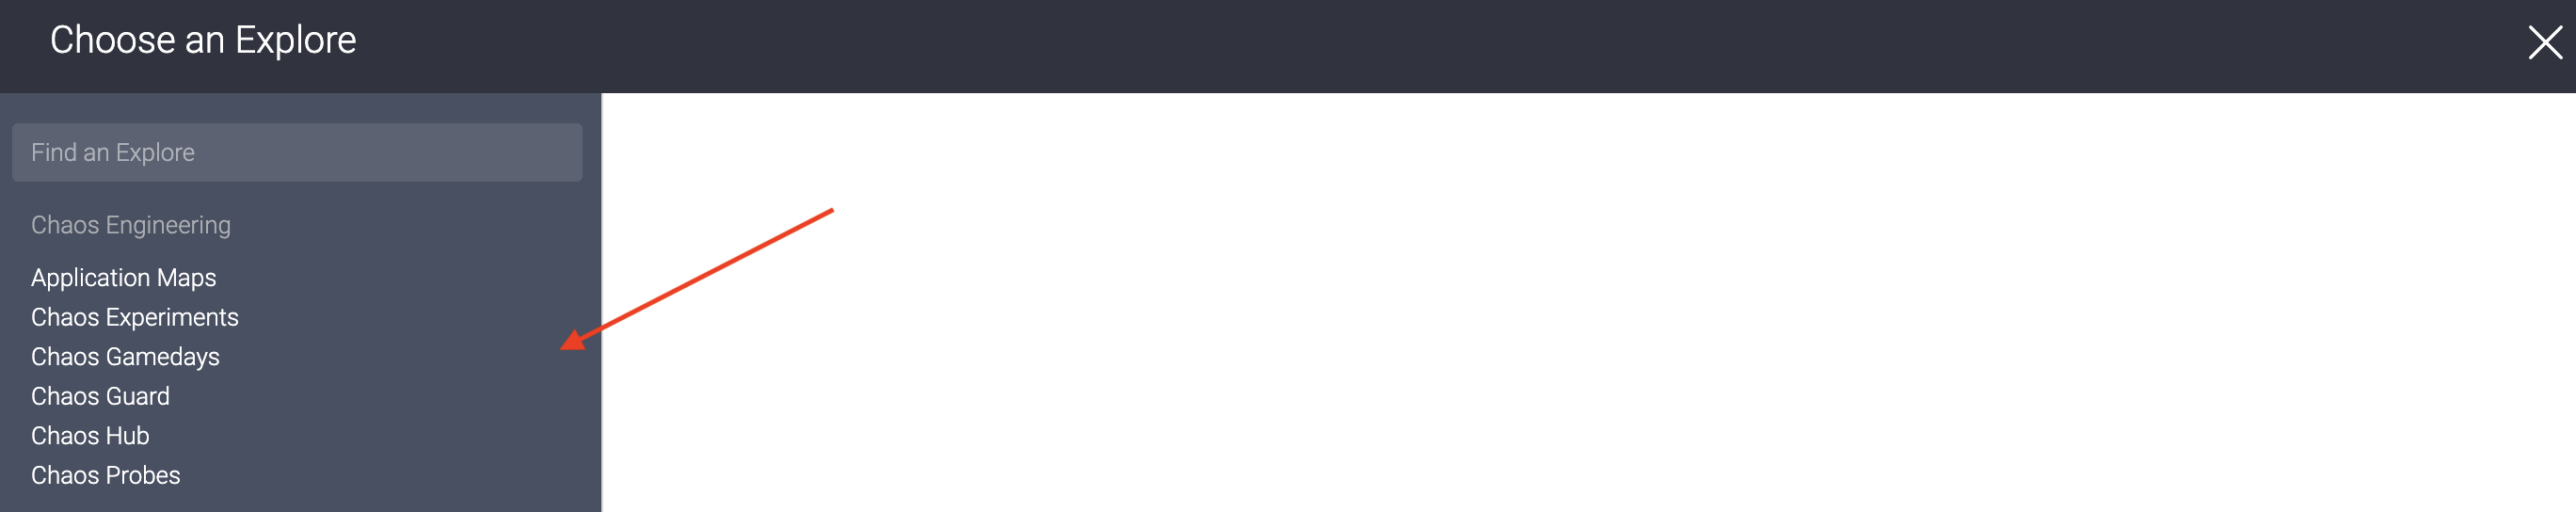
-
This will display a left bar with different fields. Provide a name for the tile. Search for the field of your choice or select two from the list.
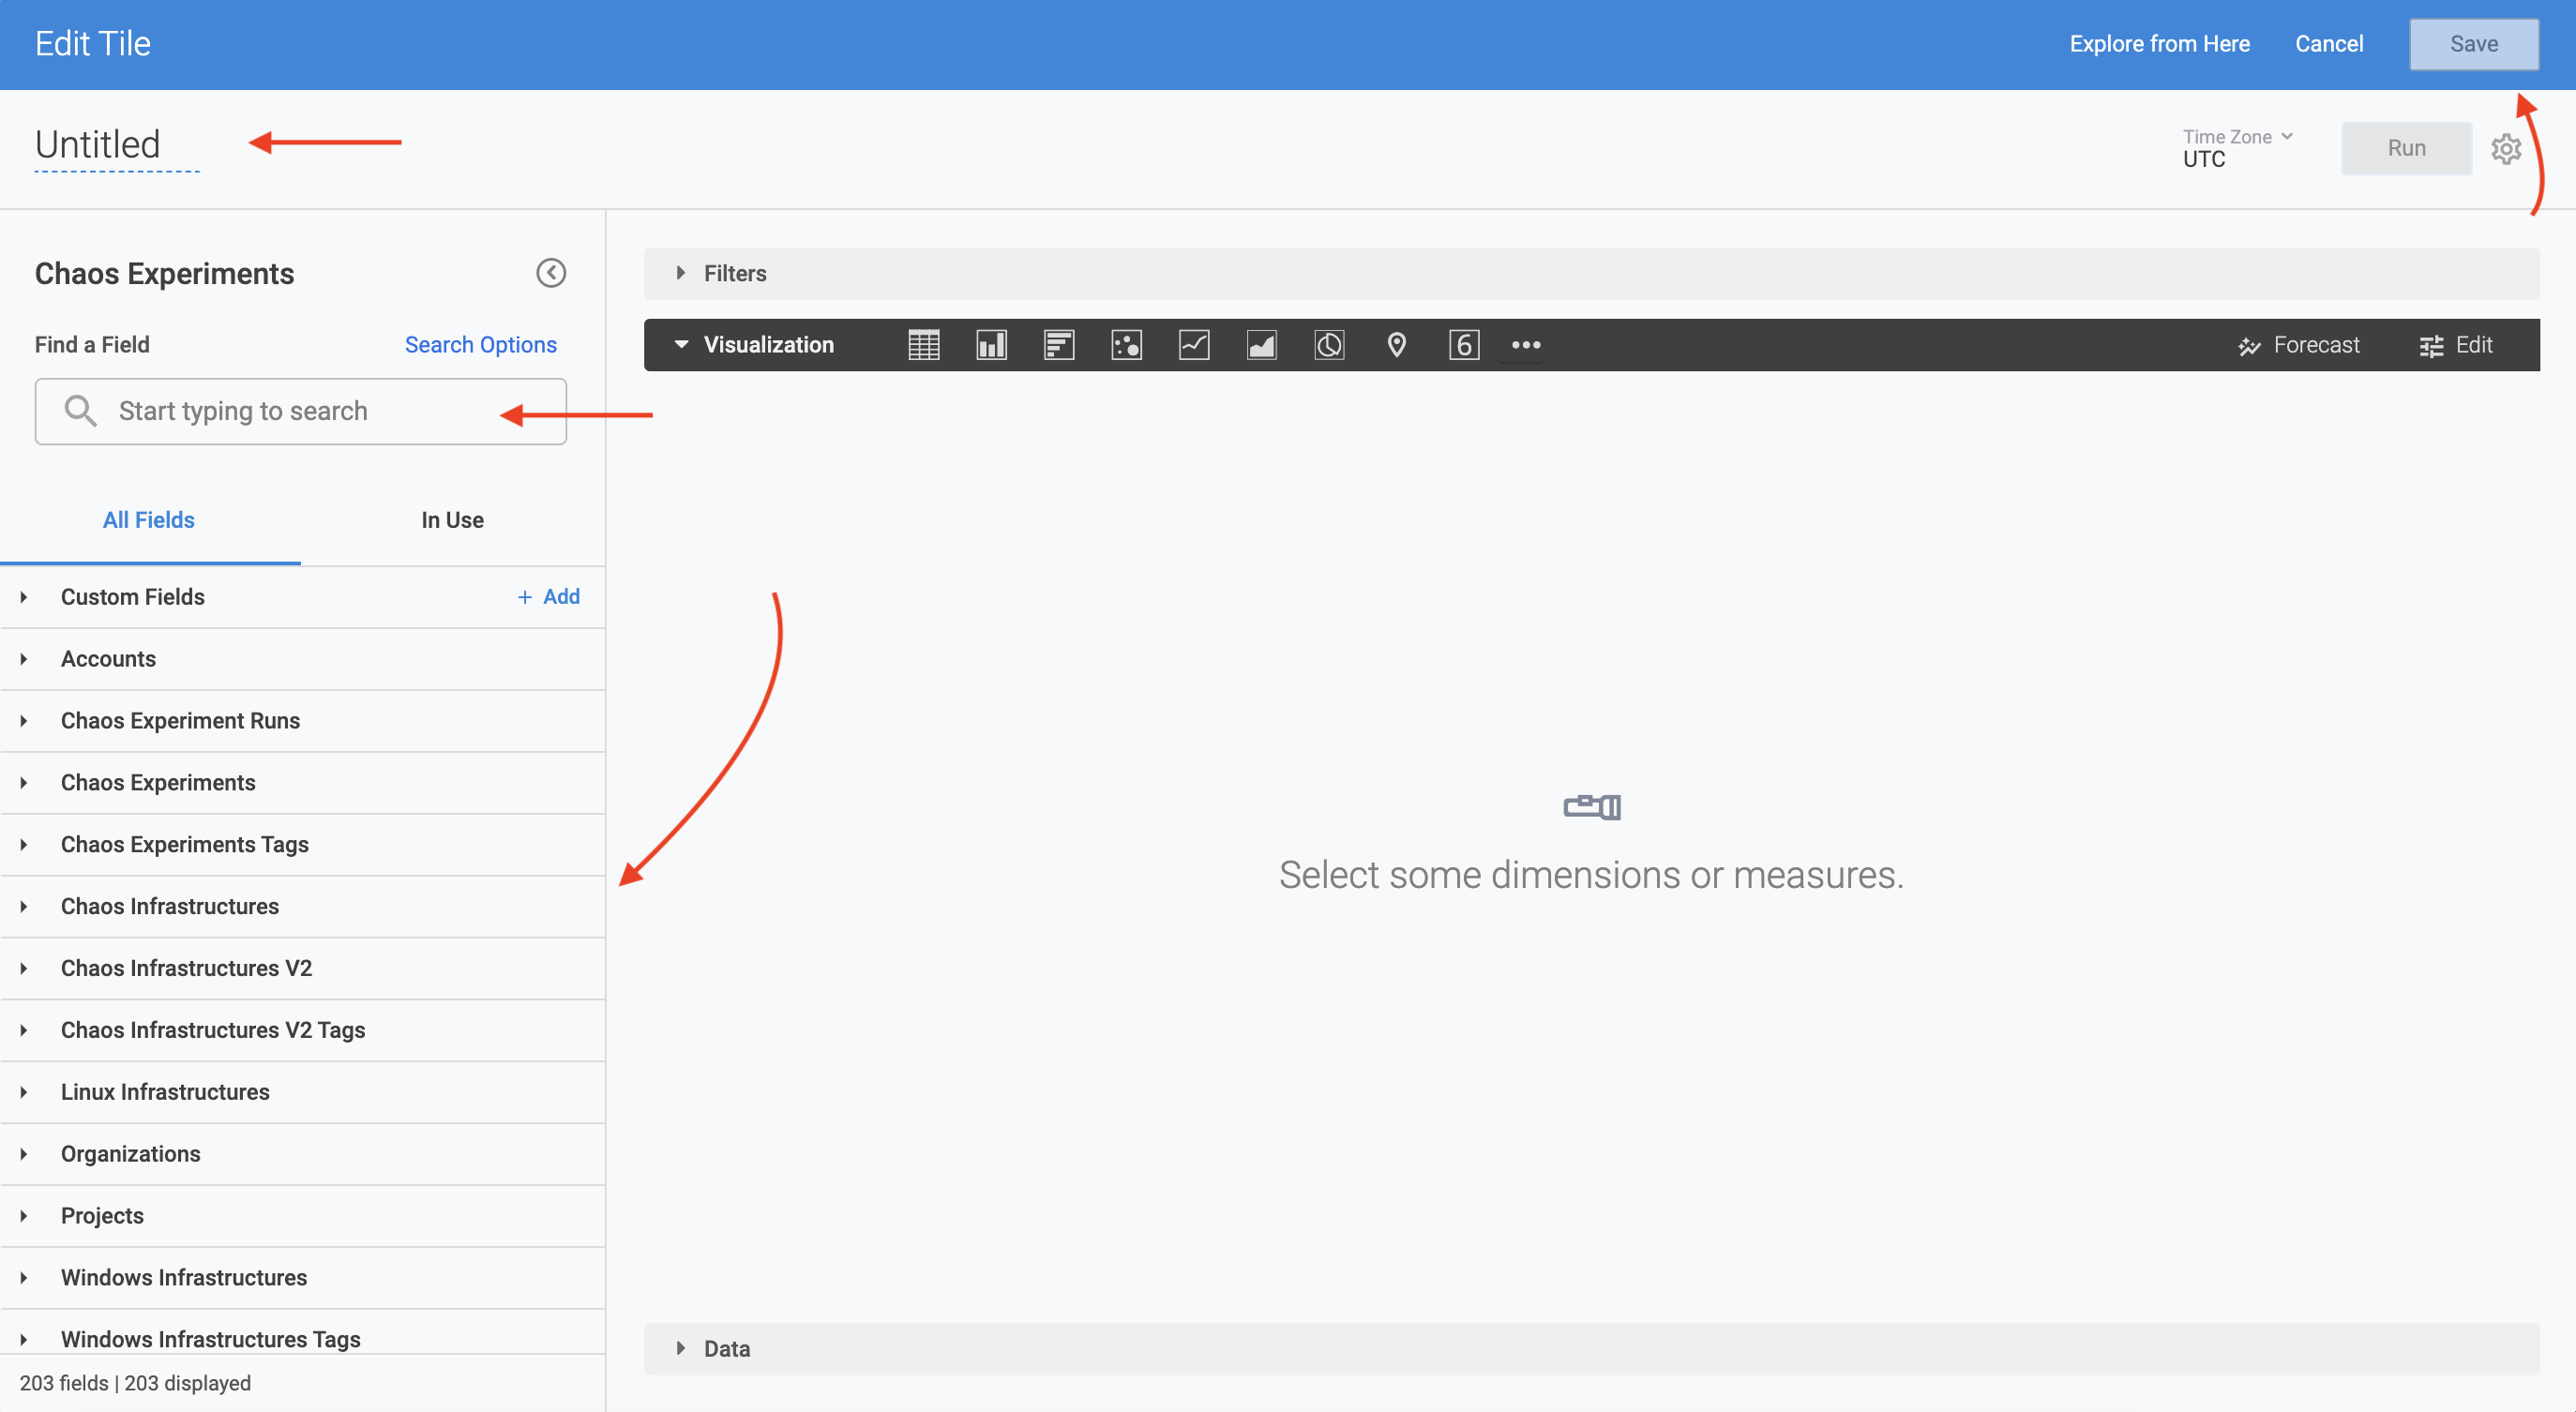
-
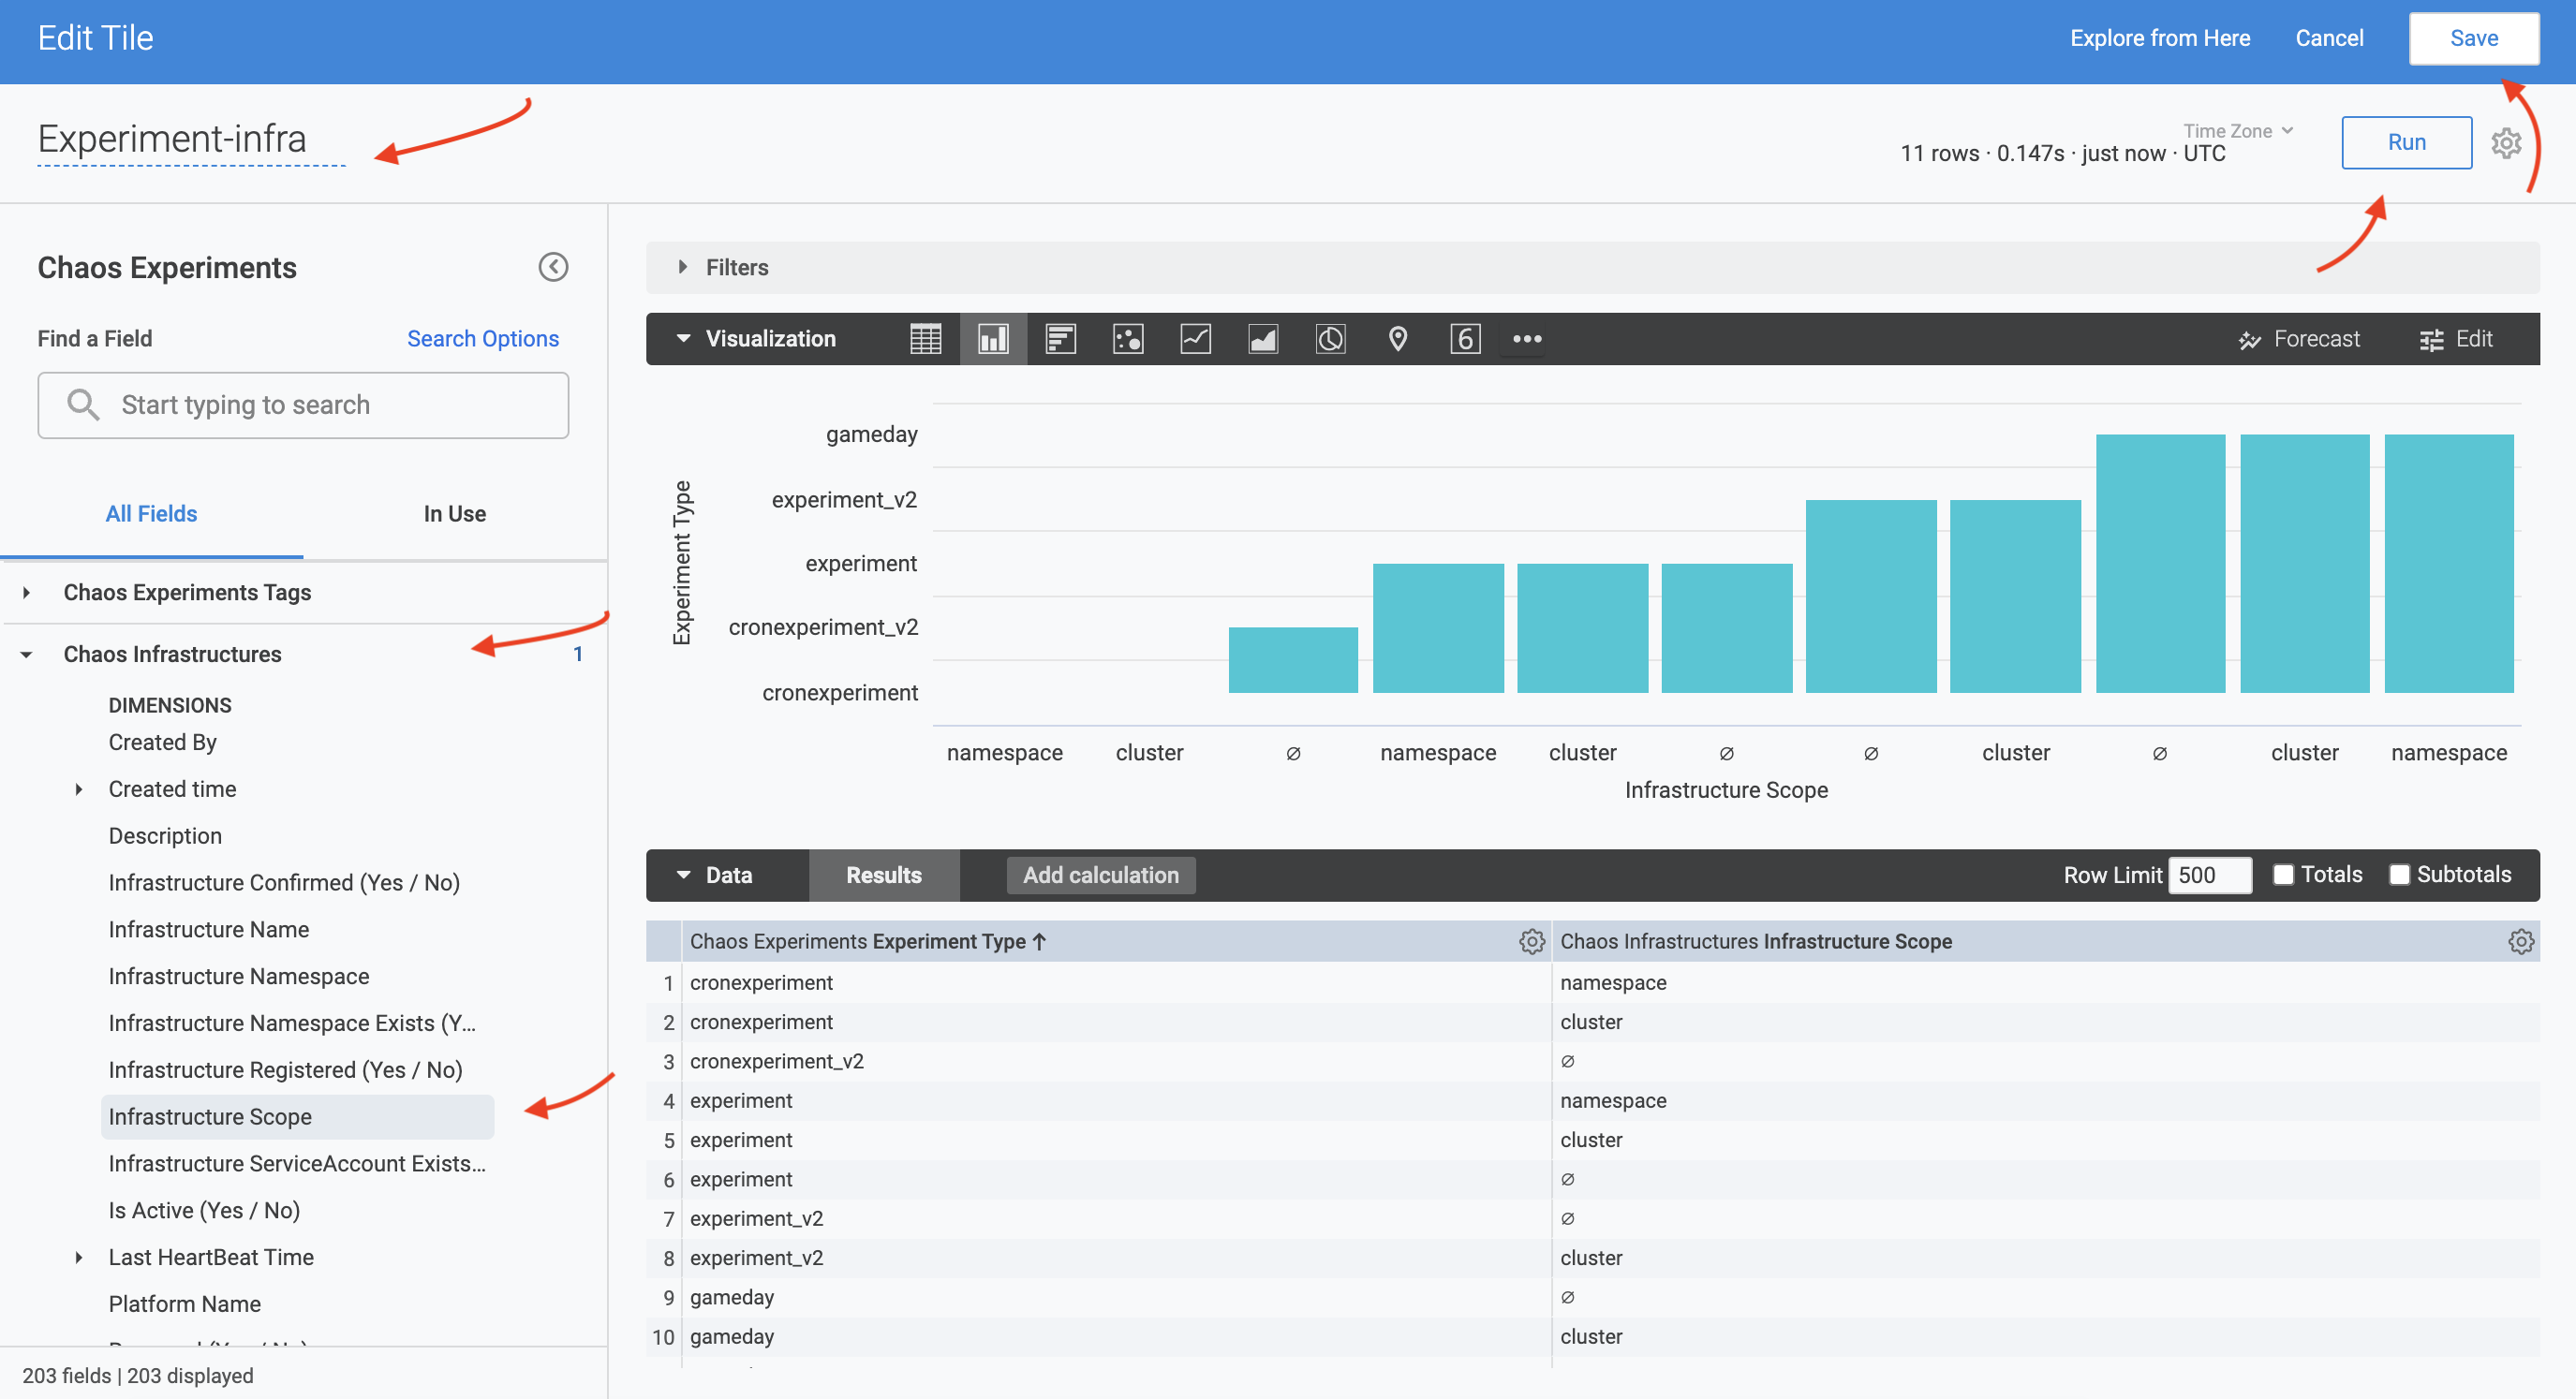
In this example, select Experiment Type from Chaos Experiments field and Infrastructure Scope from Chaos Infrastructures field. Click Run. This displays the visualization of the Infrastructure Scope versus Experiment Type. To save the results, click Save.
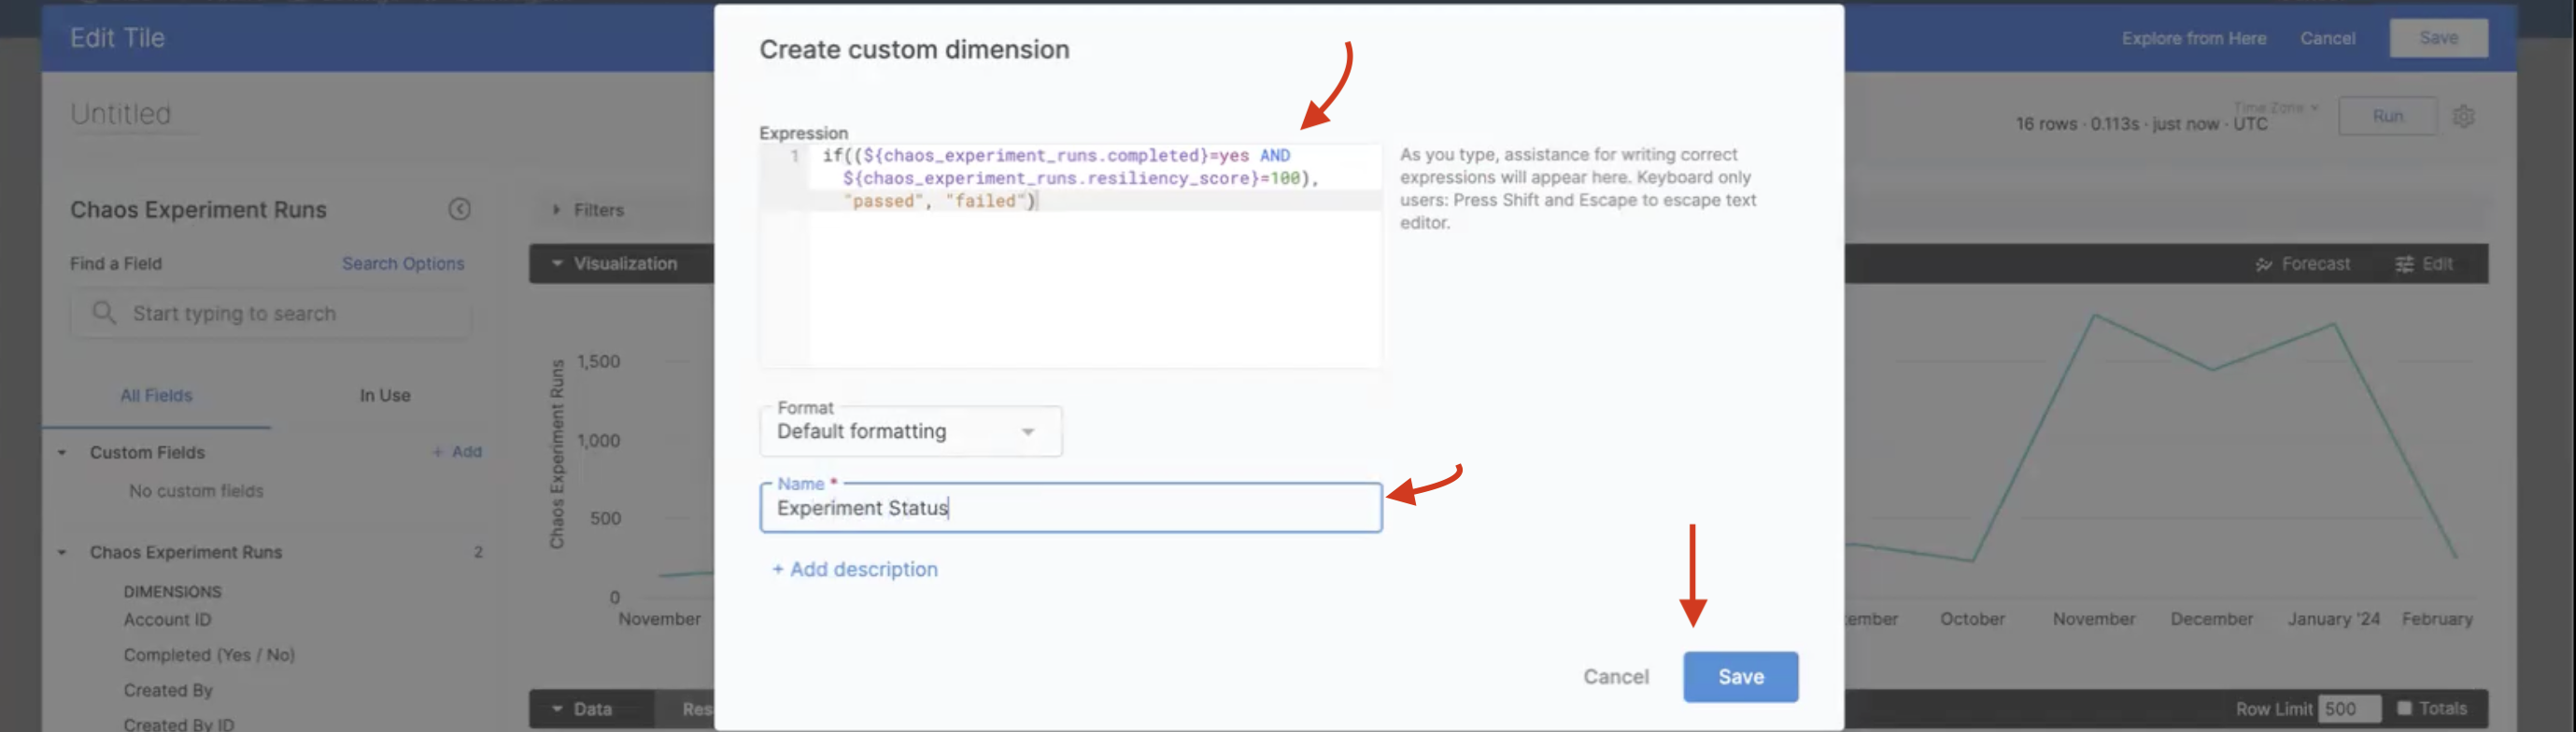
Customize Fields
To create the query to customize the field, use lookML query. Provide a name and click Save.