View dashboard
Before you begin, review the following:
View Default Chaos Dashboard
-
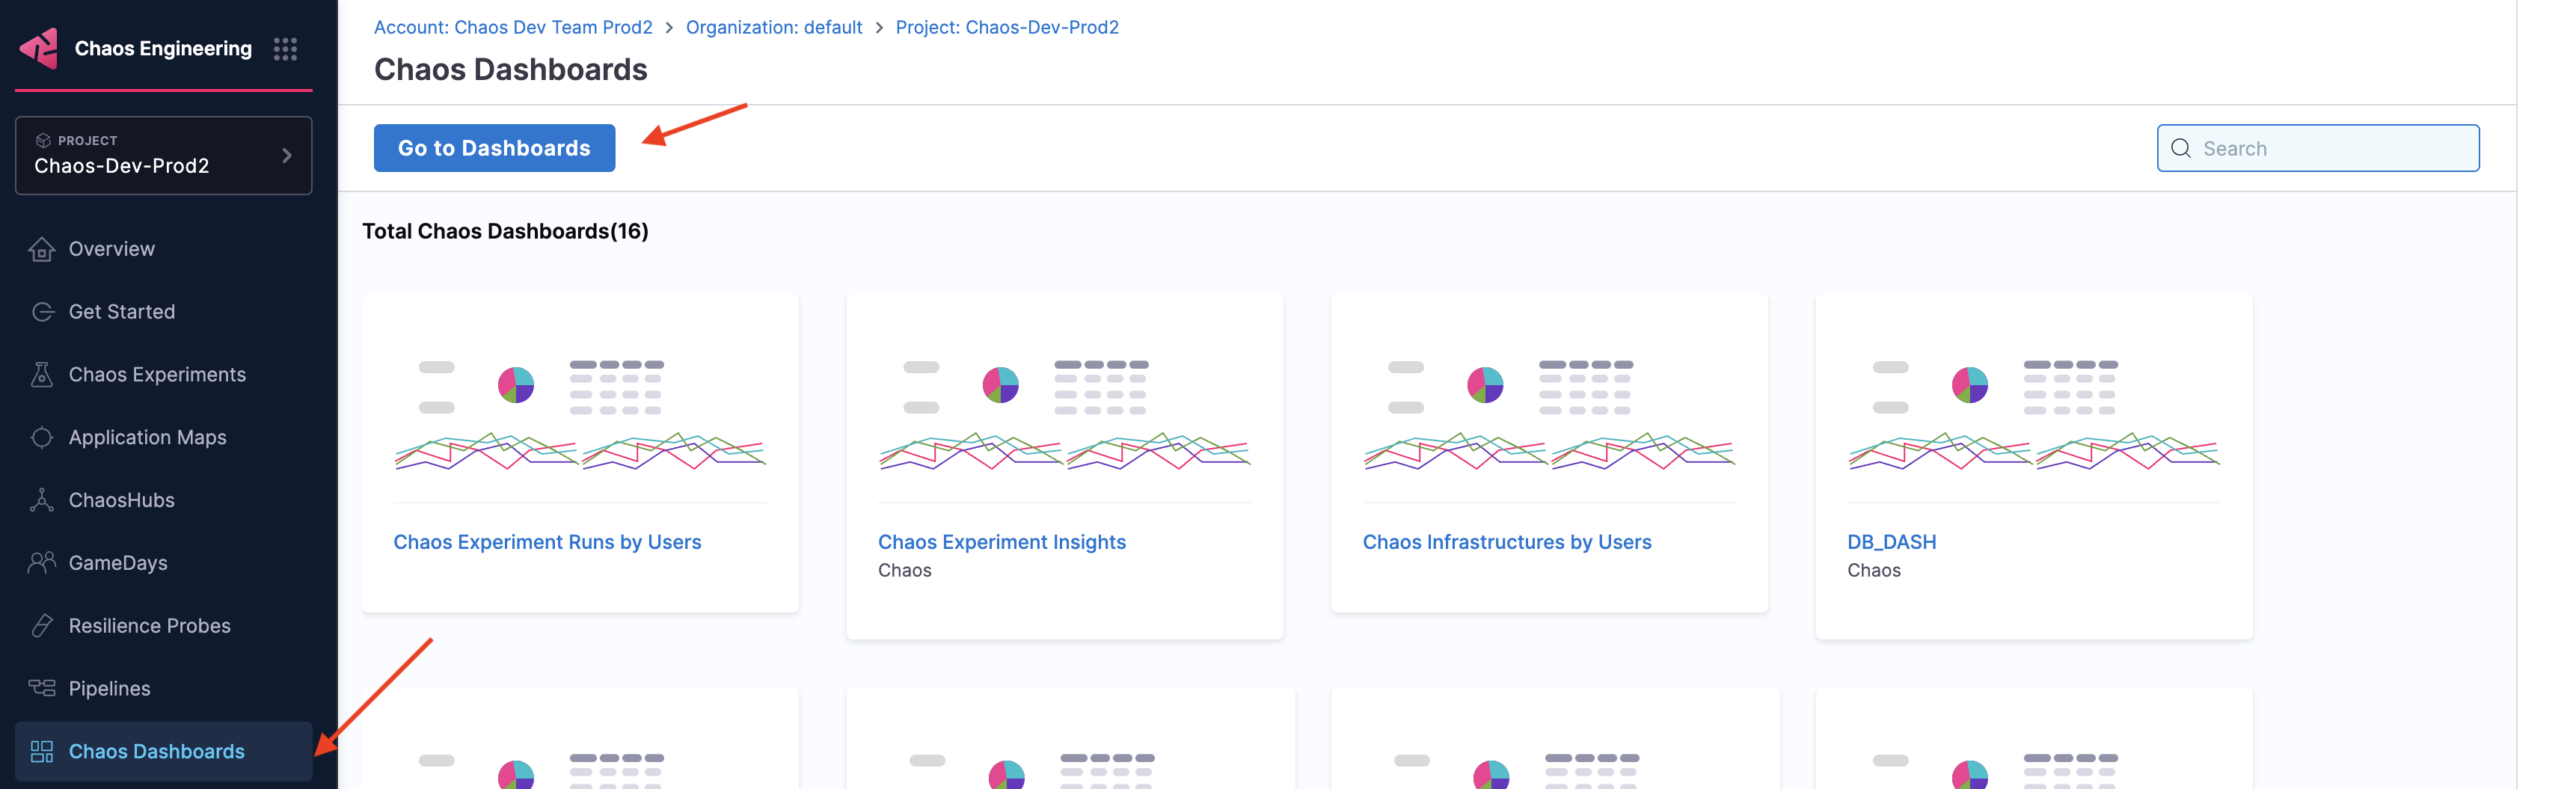
Go to Chaos Dashboards and click Go to Dashboards.
-
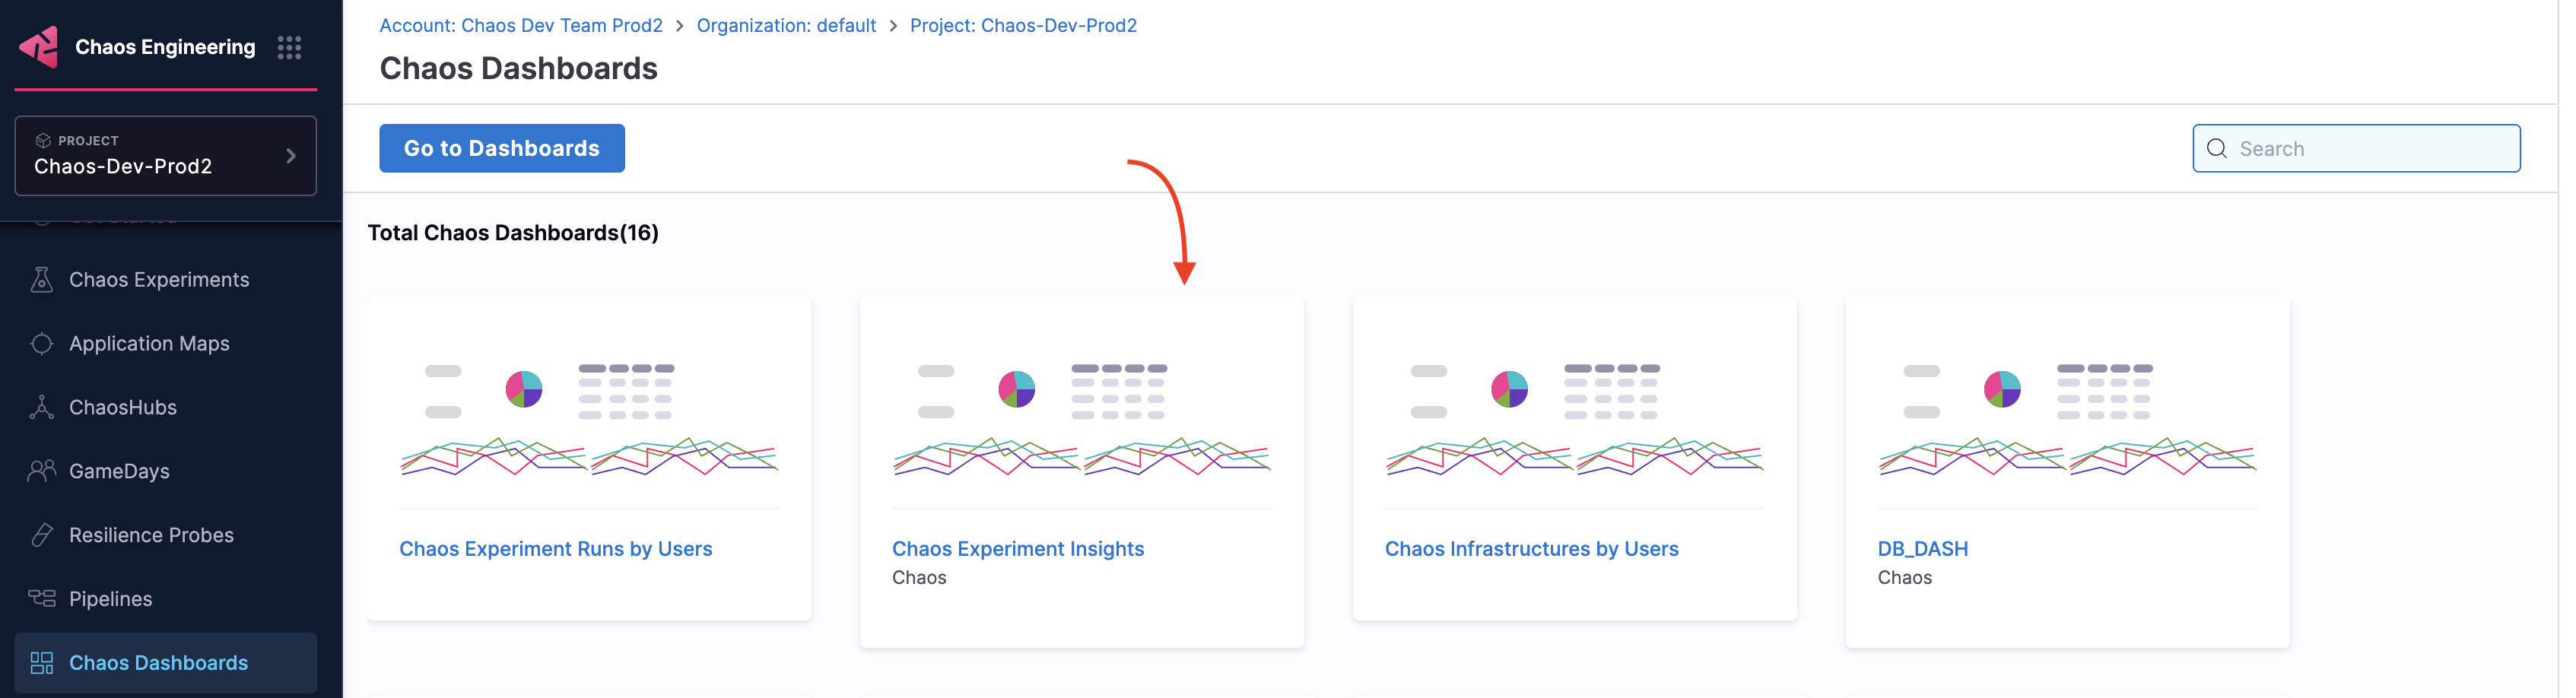
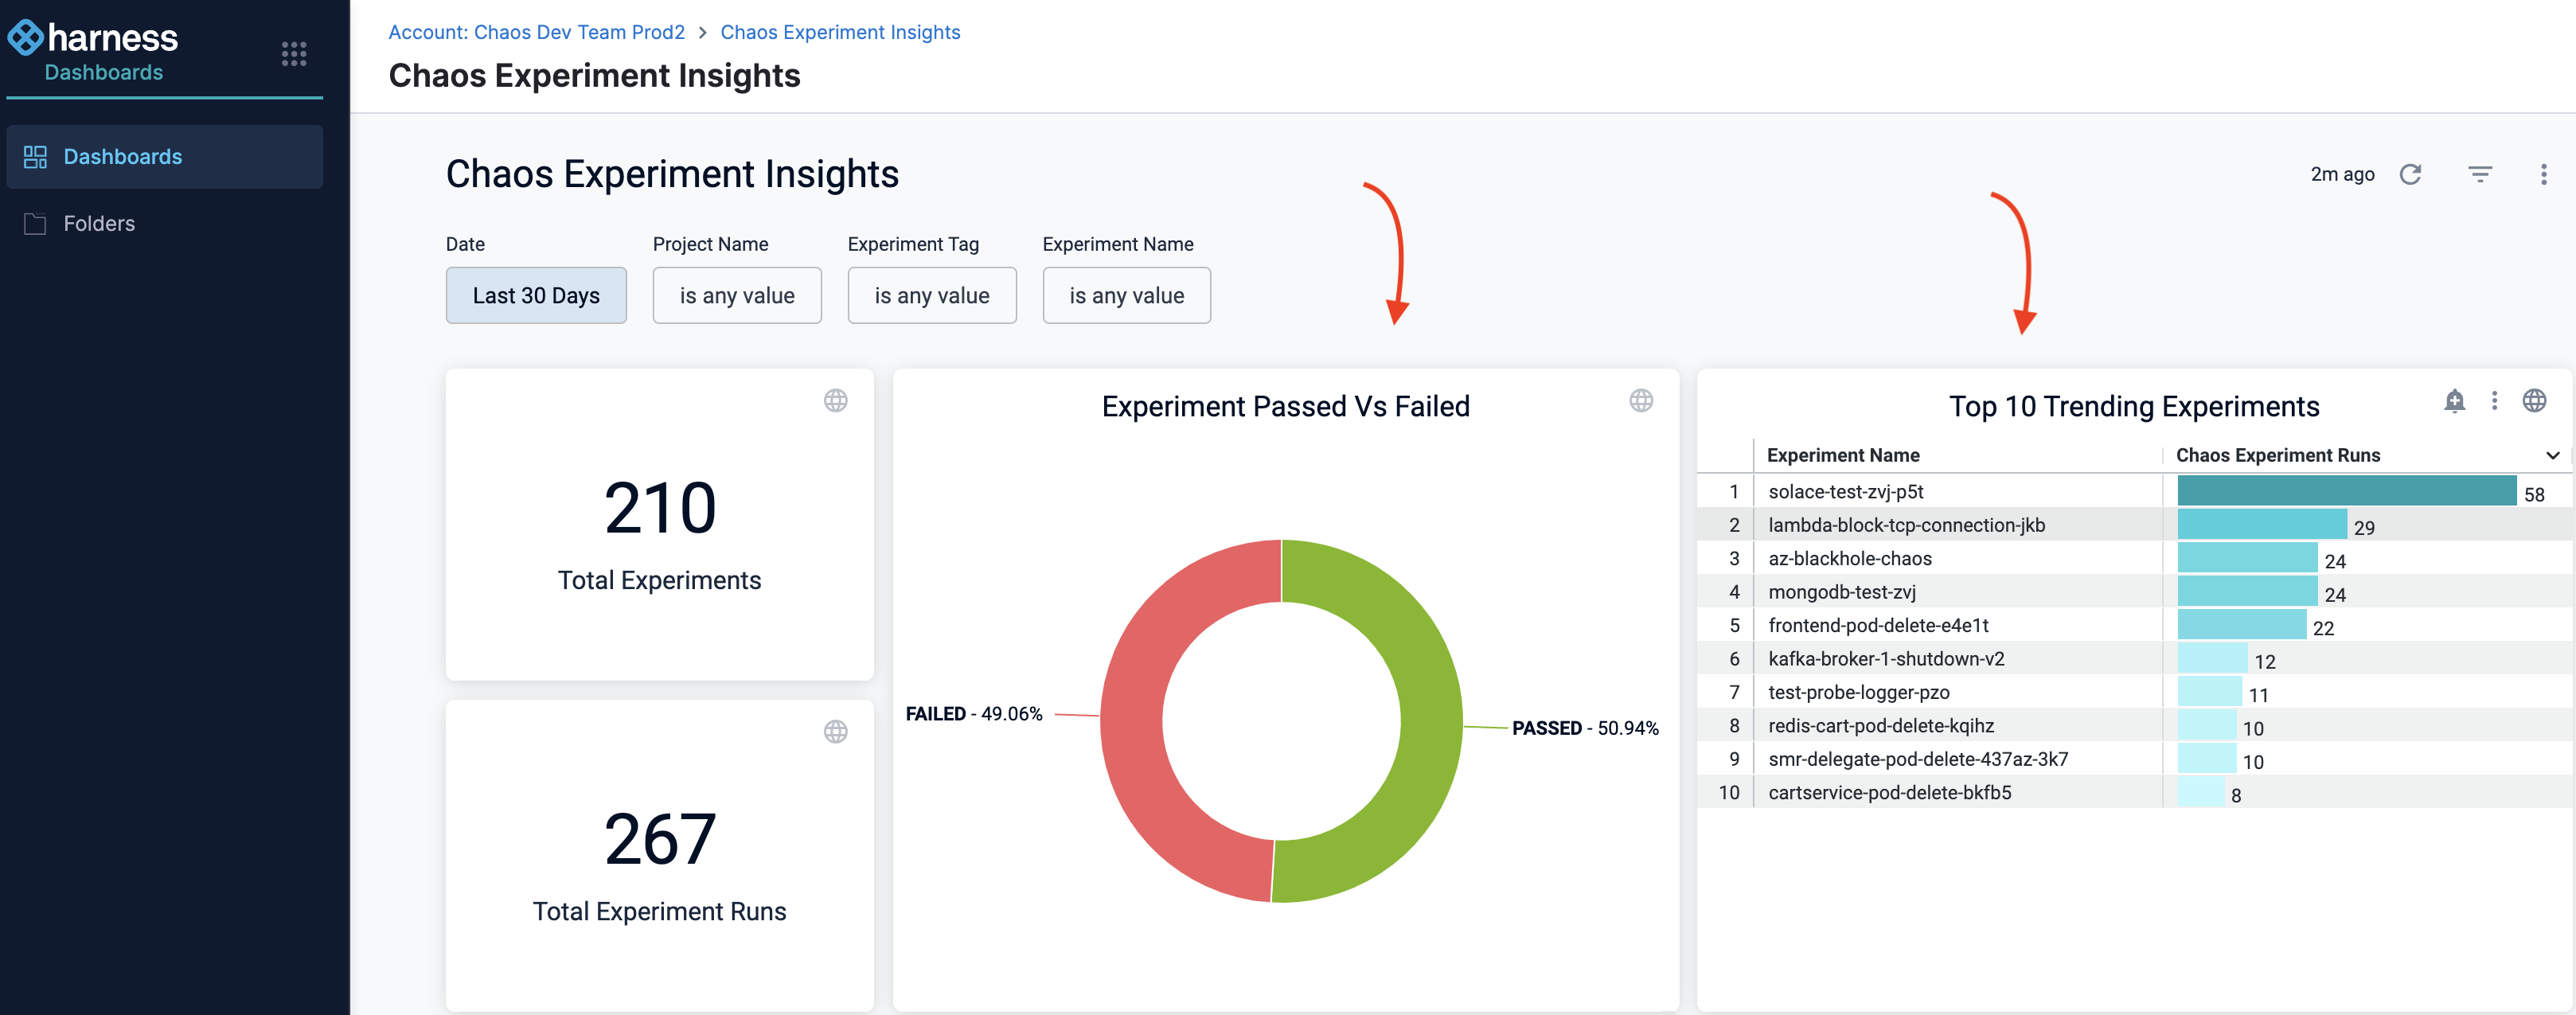
From the modules displayed at the top, select Chaos. You can see a number of predefined chaos dashboards. You can either select one of the experiments or create a new dashboard. Here, you can select a predefined chaos dashboard named Chaos Experiment Insights. You will see multiple visualizations in this predefined dashboard.
The values represented in the dashboards refer to previous week, month, and year. These visualizations don't consider the ongoing (or current) week, month, or year.
The default dashboard displays the following insights on the chaos experiments:
-
Top 10 trending experiments.
-
Visualization of the number of experiments that passed versus ones that failed.
-
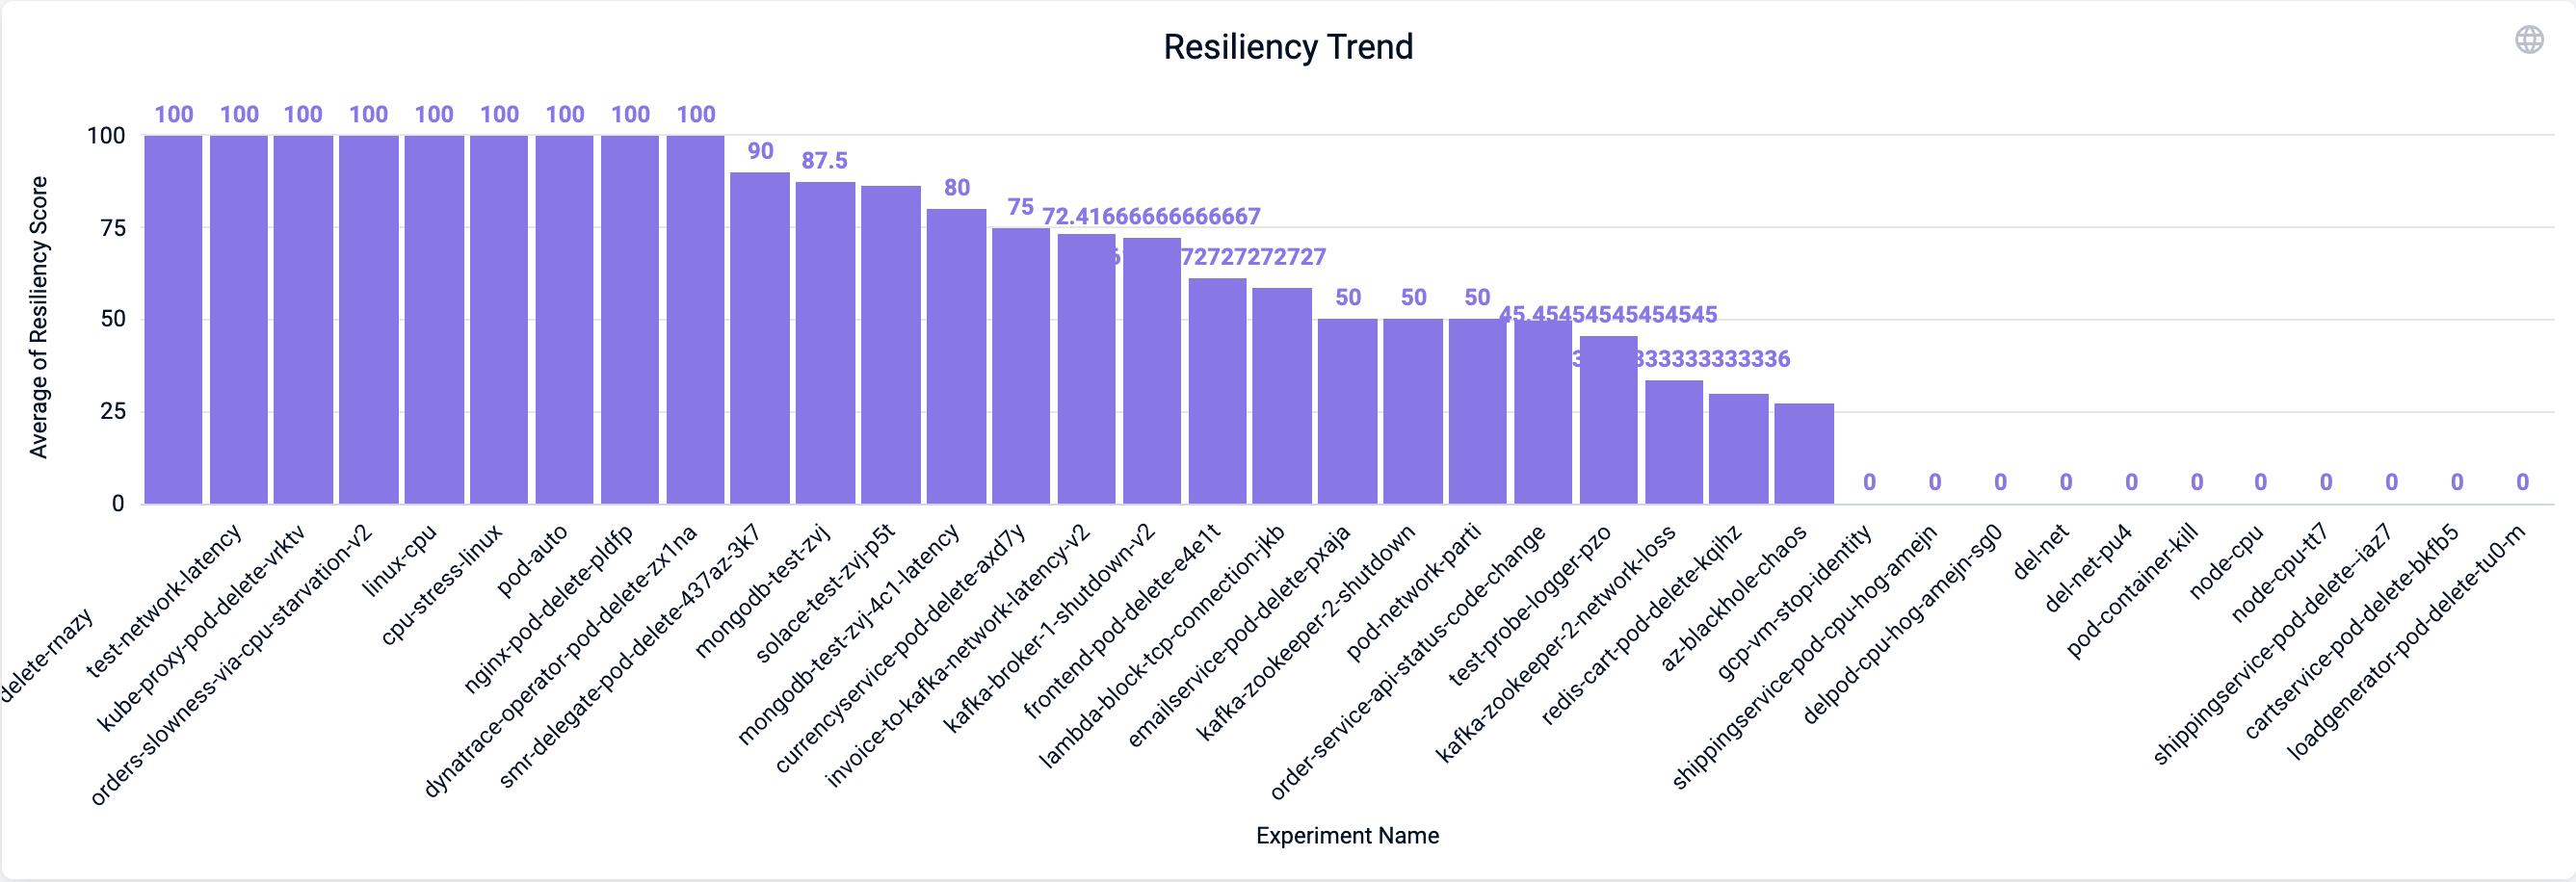
Resilience trend.
-
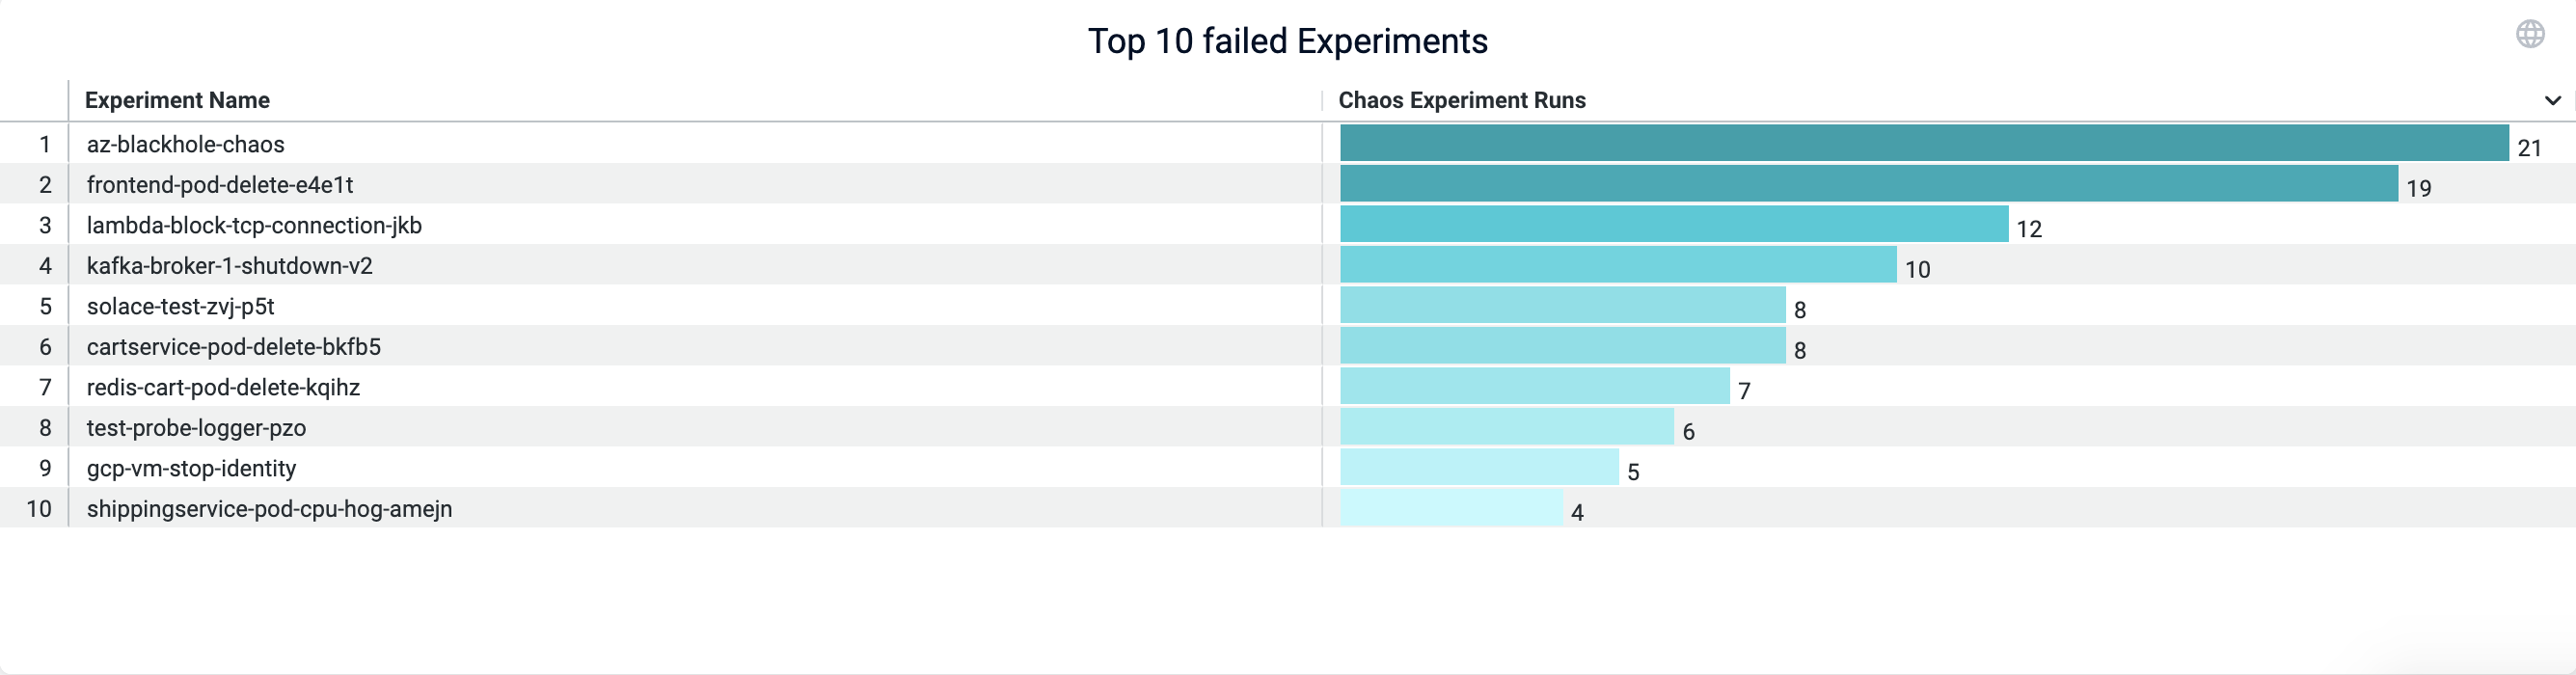
Top 10 failed experiments.
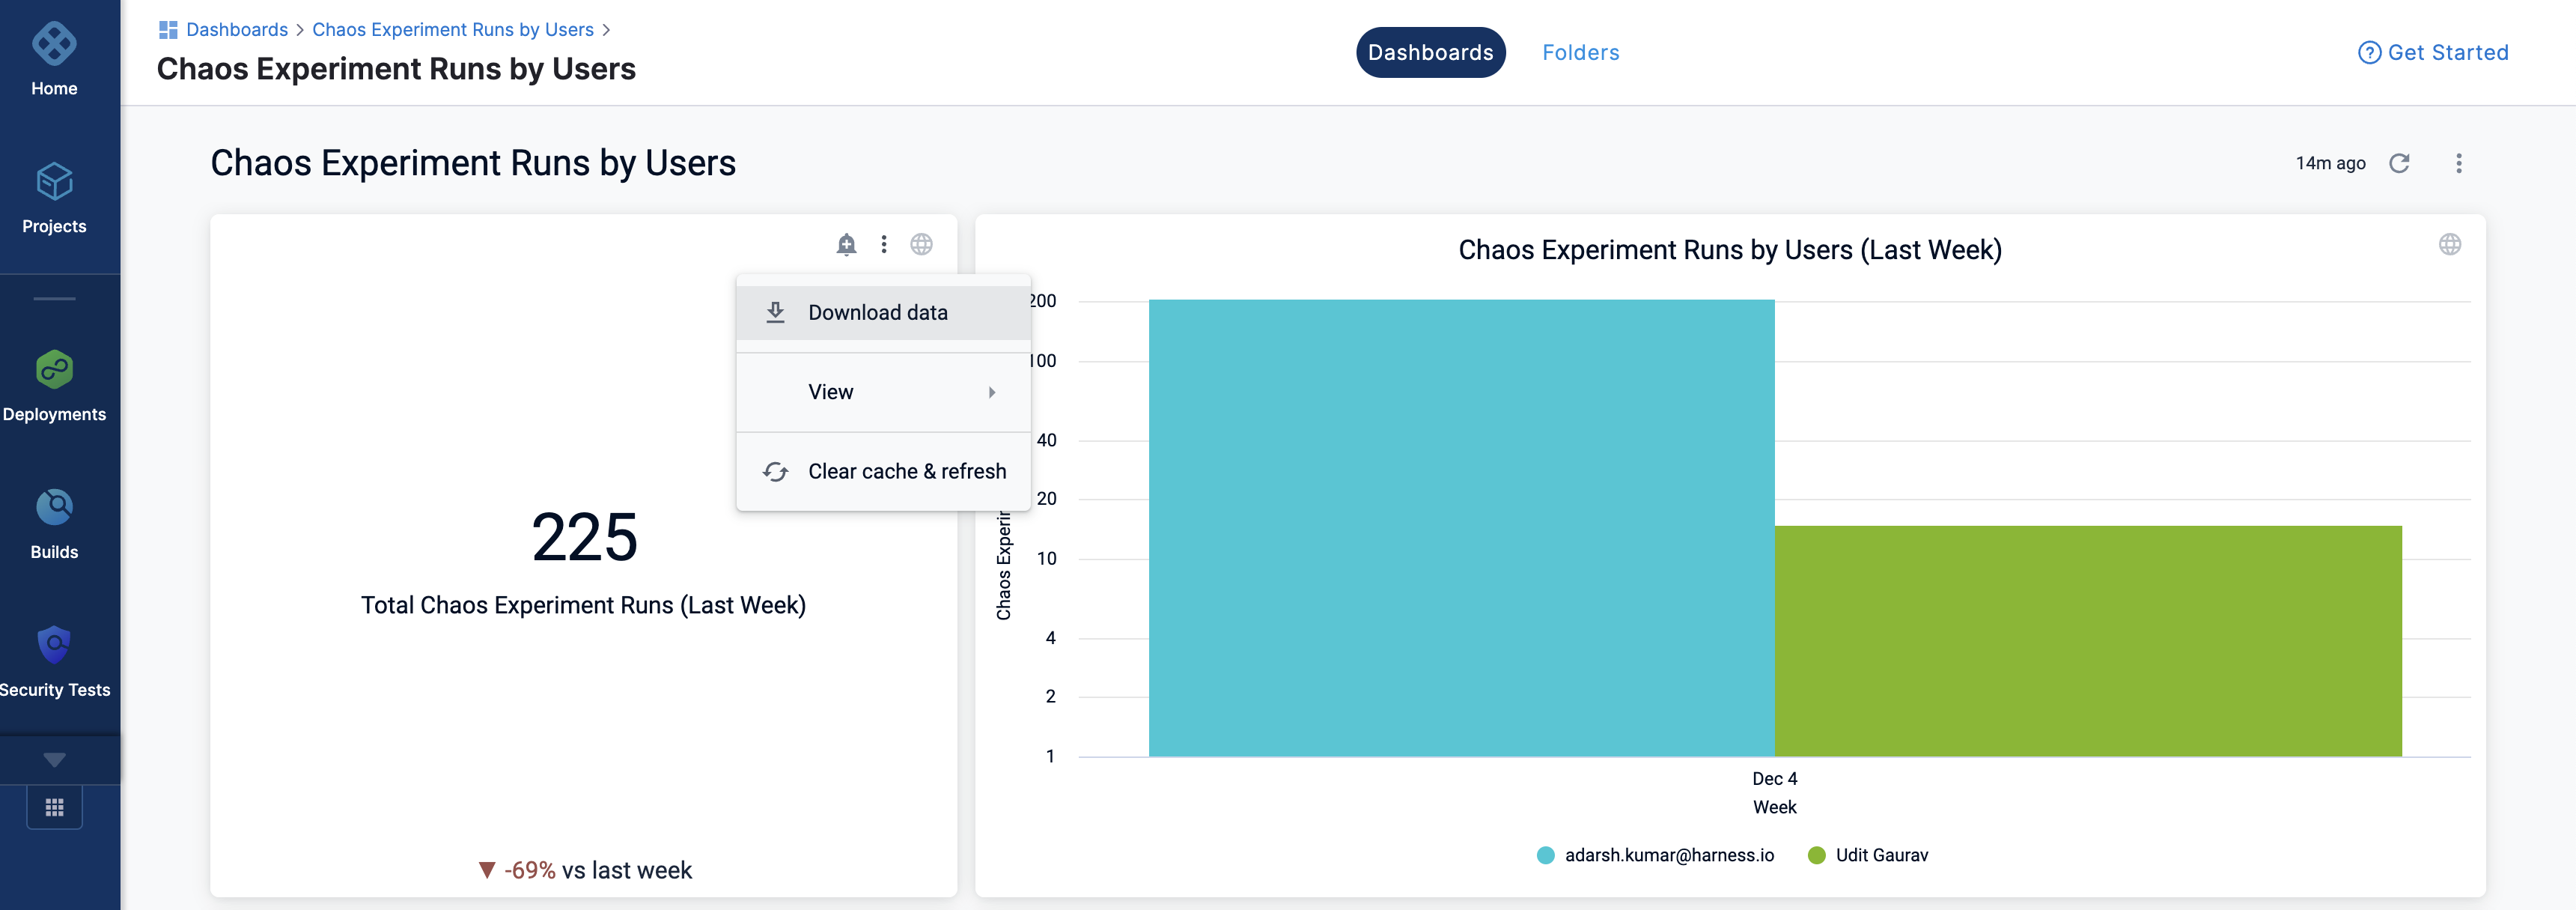
You can view the data, and download the data in different formats (such as JSON, excel, and so on.)