DORA metrics dashboard
DevOps Research and Assessment (DORA) metrics is a standard measure of DevOps performance. By understanding these metrics, you can make informed decisions and implement improvements that can help your business grow.
Create queries to pull data into your DORA dashboard
After you create a DORA metrics dashboard, you can add tiles to the dashboard.
You can edit, delete, resize, move positions, or download data of the tiles.
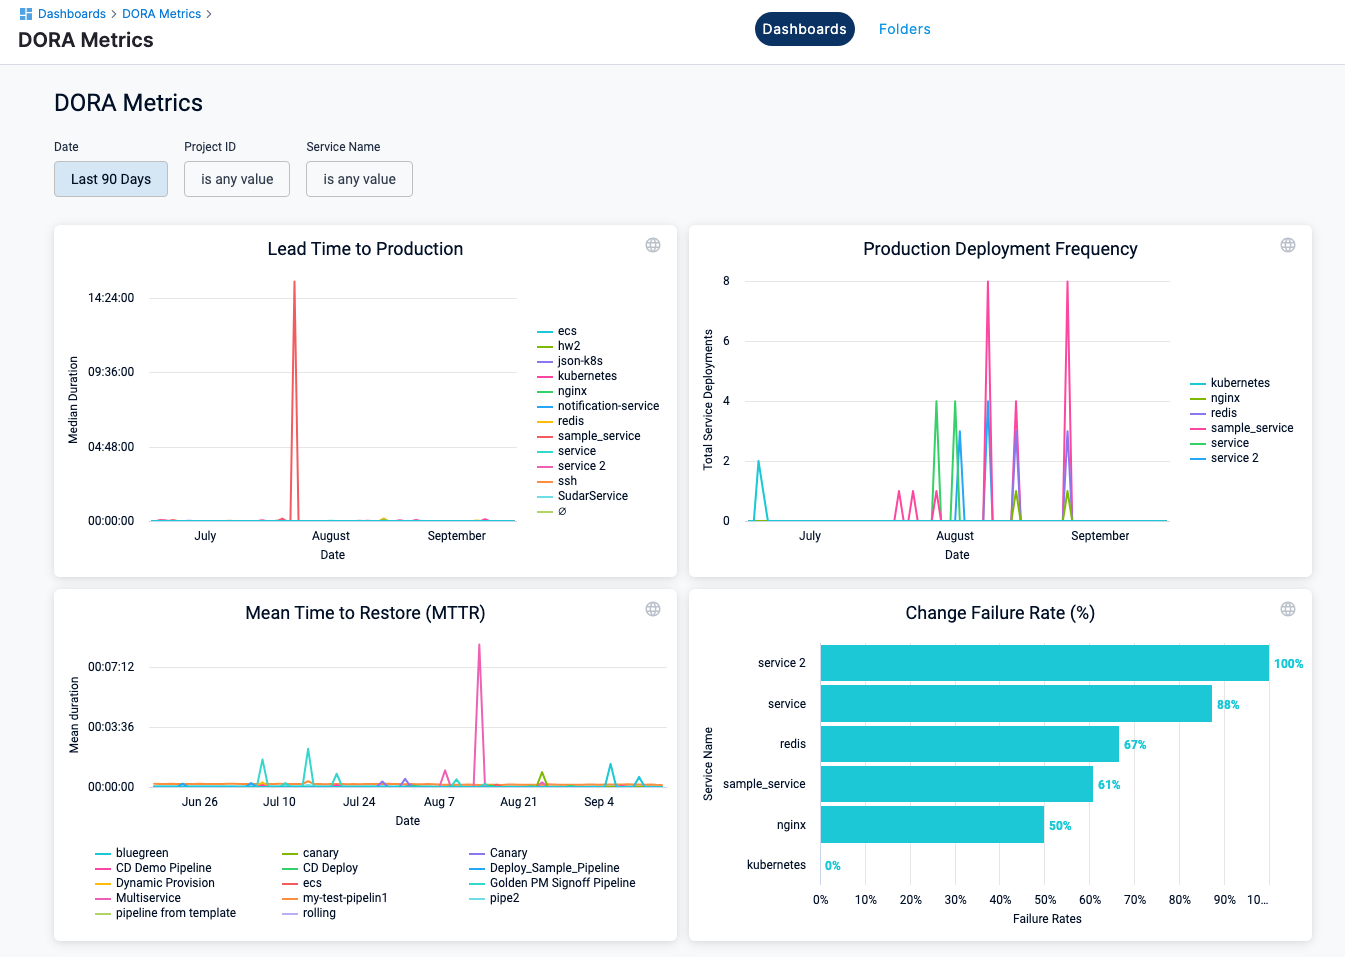
Using the DORA metrics dashboard, you can view the following metrics.
- Deployments Frequency tells you how many deployments happened in a particular duration. This metric helps measure the consistency of software delivery and delivery performance.
- Mean Time to Restore (MTTR) tells you the time taken to restore an issue found in the production environment.
- Change Failure Rate is the percentage of failure rate across all services in a given time period.
- Lead Time to Production shows the median duration of deployments.
To gain deeper insights, you can create queries in the dashboard to capture data. Harness captures metrics for each service-environment combination within a pipeline. If you have a multi-service pipeline, metrics for each service-environment combination will be captured and reported separately.
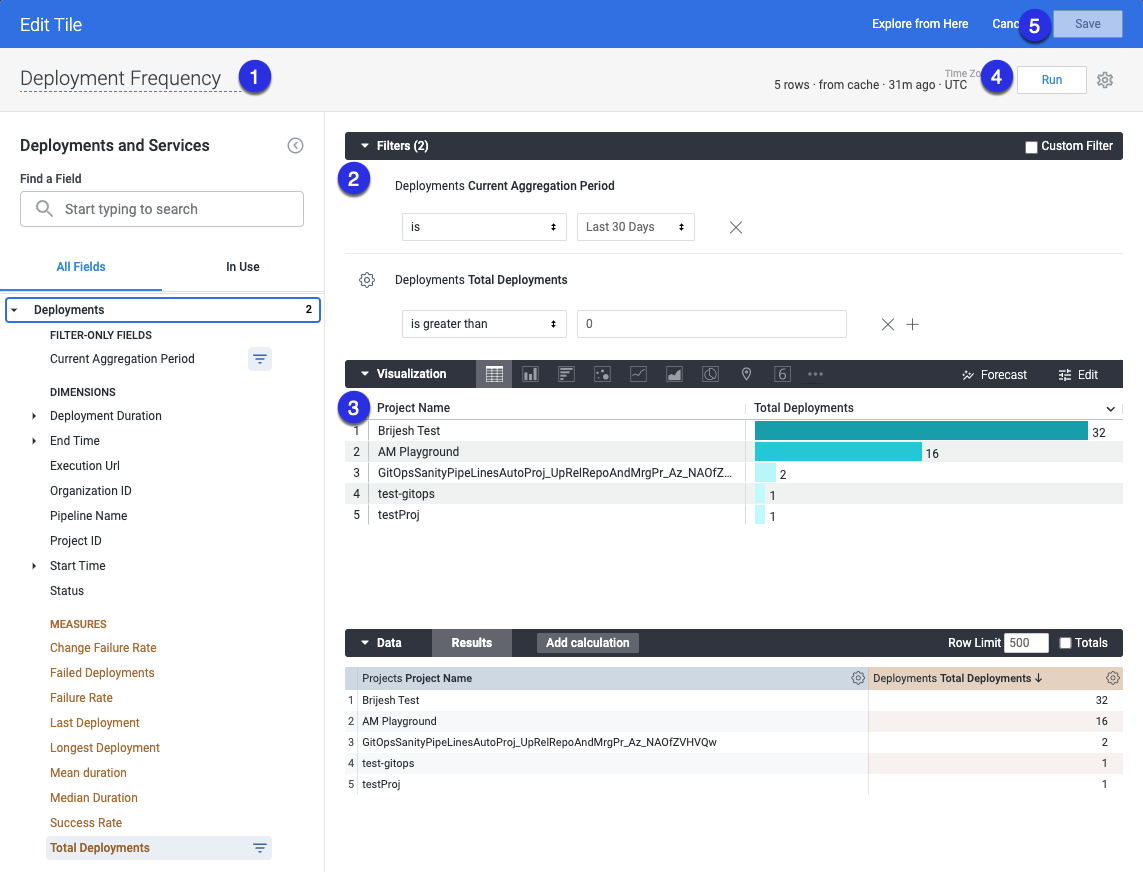
Deployment frequency
- Enter a name your query. For example, Deployment Frequency.
- Select the following filters.
- In Deployments, select Custom Aggregation Period, then select the time period.
- In Deployments, select Total Deployments.
- Configure your visualization options. For more information, go to create visualization and graphs.
- Select Run.
- Select Save to save the query as a tile on your dashboard.
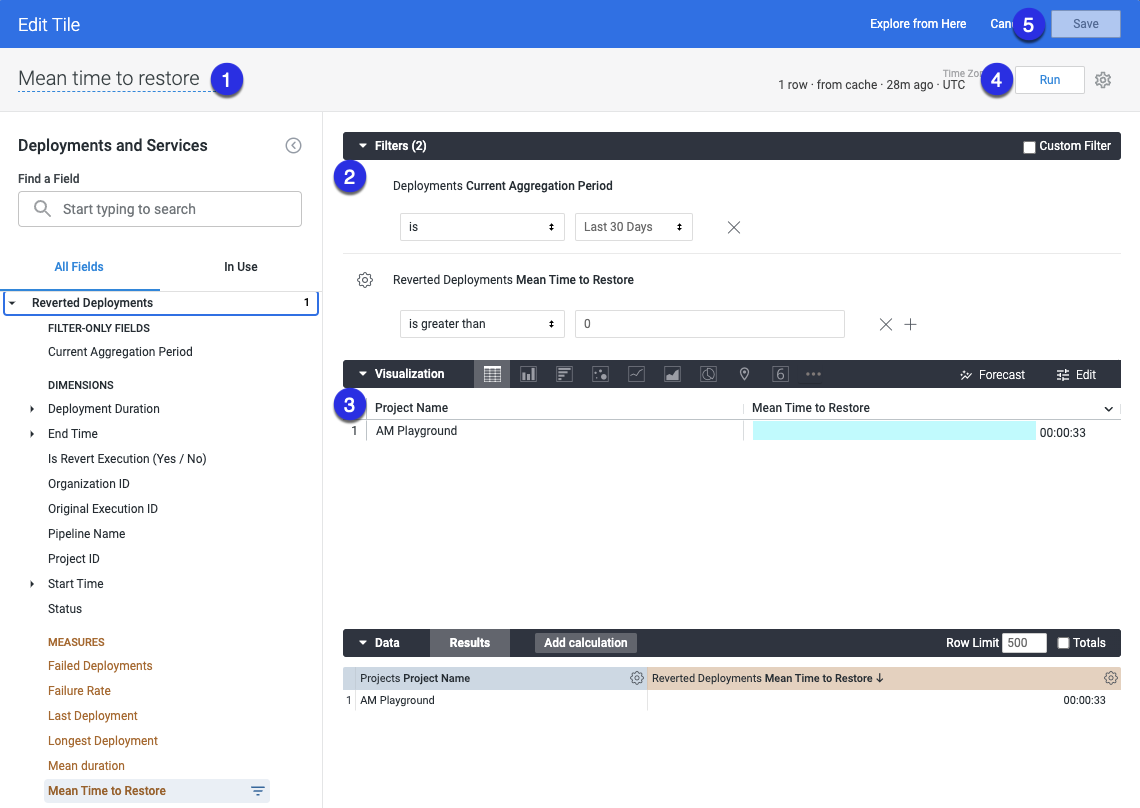
Mean time to restore
- Enter a name your query. For example, Mean Time to Restore.
- Select the following filters.
- In Deployments, select Custom Aggregation Period, then select the time period.
- In Reverted Deployments, select Mean Time to Restore.
- Configure your visualization options. For more information, go to create visualization and graphs.
- Select Run.
- Select Save to save the query as a tile on your dashboard.
Use reverted executions to capture mean time to restore
- This only works for executions reverted using post production rollback feature.
Currently, Harness does not measure regressions or failures that occur after a production deployment is complete.
During the pipeline deployment, if there is an issue that causes downtime, a reverted pipeline execution can restore the service.
You can mark a pipeline execution as a restored/reverted pipeline and link it to the pipeline execution that introduced the issue.
You can then use the difference between the end time of the parent execution and the end time of the reverted execution to capture mean time to restore.
In the pipeline YAML, you can add the following sample expression as a tag:
  tags:
    reverted_execution_id: <+pipeline.originalExecution.executionId>
Below is an example of a pipeline execution. The reverted_execution_id tag represents the execution Id of the pipeline that was reverted.
pipeline:
  identifier: "DOra_pipeline"
  tags:
    reverted_execution_id: "Q0bizp0QTM6xtB1FZsR0zQ"
  stages:
  - stage:
      identifier: "stage1"
      type: "Deployment"
      spec:
        service:
          serviceRef: "Ser2"
        environment:
          environmentRef: "Env2"
          infrastructureDefinitions:
          - identifier: "Infra_2"
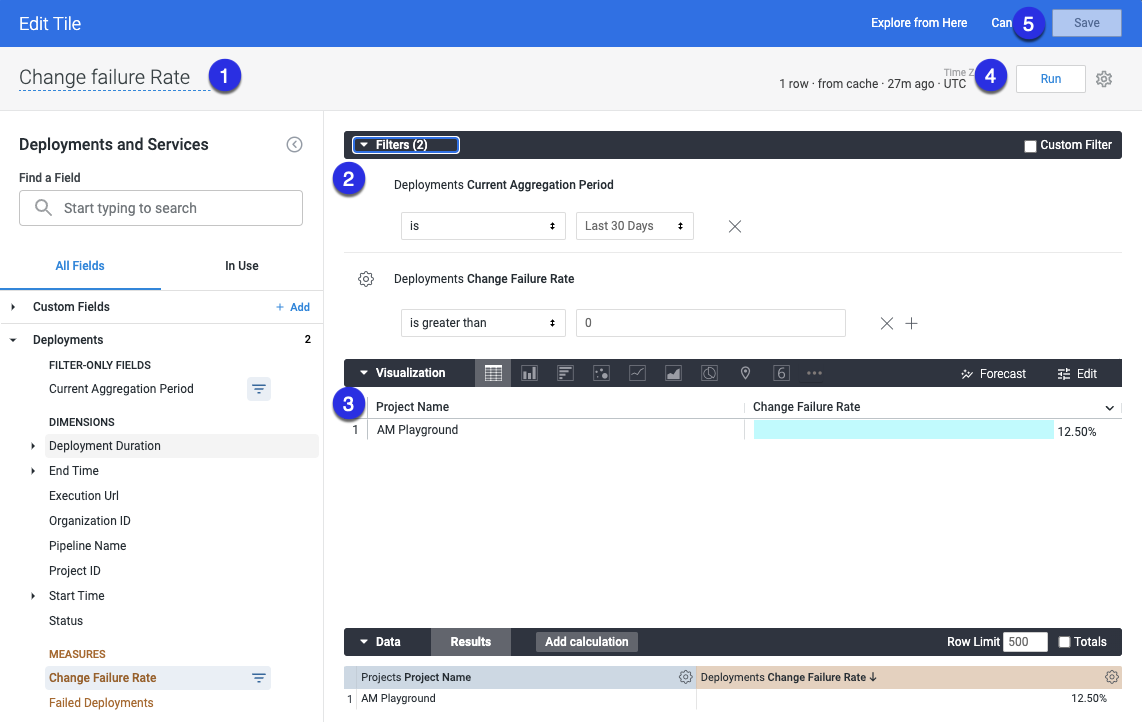
Change failure rate
- Enter a name your query. For example, Change Failure Rate.
- In Deployments, select Custom Aggregation Period, then select the time period.
- In Deployments, select Change Failure Rate.
- Configure your visualization options. For more information, go to create visualization and graphs.
- Select Run.
- Select Save to save the query as a tile on your dashboard.
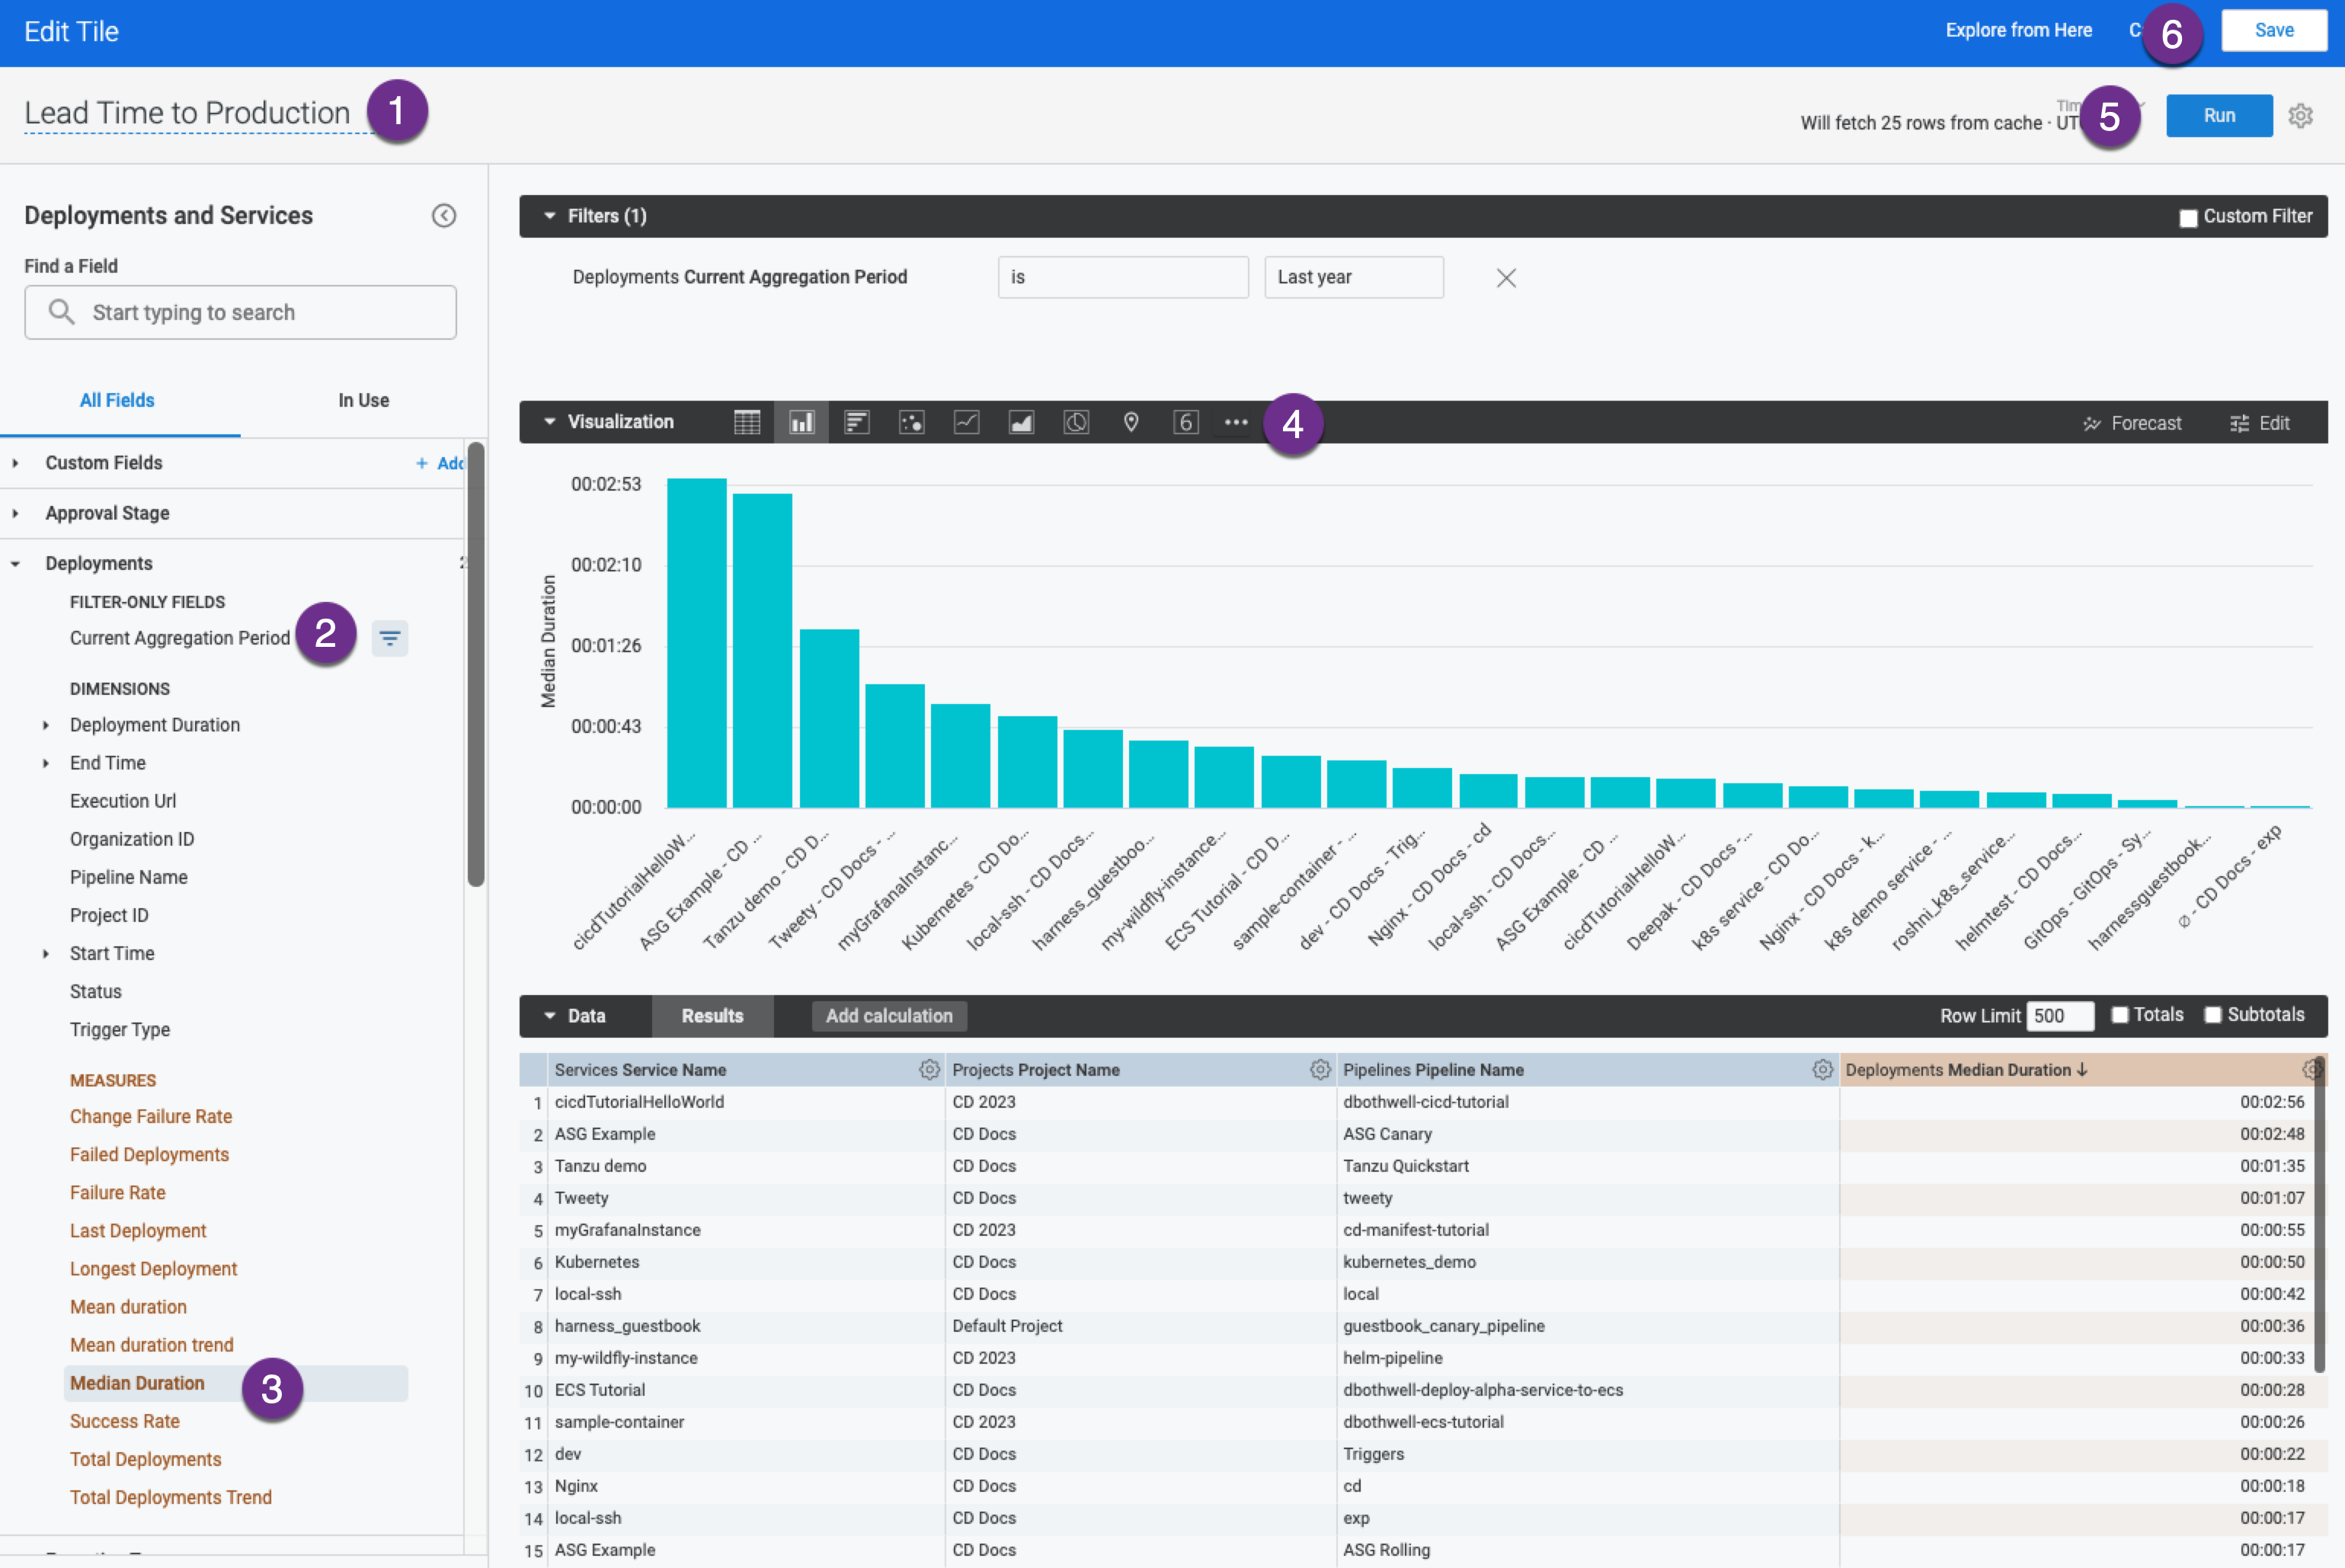
Lead time to production
Lead Time to Production shows the median duration of deployments.
- Enter a name for your query. For example, Lead Time to Production.
- In Deployments, select Custom Aggregation Period, then select the time period.
- In Deployments, select Median Duration.
- Configure your visualization options. For more information, go to create visualization and graphs.
- Select Run.
- Select Save to save the query as a tile on your dashboard.
Improve DORA reporting with Harness Software Engineering Insights
While the DORA metrics dashboard in Harness CD provides visibility into deployment frequency, lead time, failure rates, and recovery times, it focuses primarily on deployment activity within Harness pipelines.
This view may not fully capture bottlenecks or inefficiencies in upstream stages of the software delivery lifecycle (SDLC), such as hygiene in the issue management systems, code review delays, testing gaps, or build tool inefficiencies.
For a holistic view of software delivery performance across your entire toolchain (e.g., Jira, Jenkins, GitHub, Harness CD), use the DORA dashboard in Harness Software Engineering Insights (SEI).
This dashboard is powered by:
- DORA profile: Allows you to define the software delivery lifecycle with customizable thresholds and higher granularity for measuring DORA metrics.
- Correlation engine: Analyzes data from all integrated tools (Issue management system, CI, CD, SCM, incident management, etc.) to identify root causes of bottlenecks. For example:
- Long lead times caused by code review delays in GitHub
- High failure rates linked to flaky tests in Jenkins pipelines
- Recovery time outliers correlated with specific service architectures
Use the CD DORA dashboard for pipeline-level metrics, and Software Engineering Insights for organization-wide optimization.