View services dashboard (FirstGen)
Currently, this feature is behind the Feature Flags TIME_SCALE_CG_SYNC and CUSTOM_DASHBOARD_V2. Contact Harness Support to enable the feature.
The FirstGen custom dashboards in Harness NextGen display information for your Harness FirstGen deployments.
Dashboards help you model and analyze business metrics and operational data. You can use this data to make data-driven business decisions. Using charts, data tables, and filters, Dashboards help you get the most useful services data.
Harness provides pre-loaded By Harness (pre-defined) and Custom (user-defined) Dashboards to visualize deployments data across your Applications, Services, and Environment. Using the Services (FirstGen) Dashboard you can:
- Discover new analytical insights into your Services
- Track production and non-production instances across different zones and time range in a logical and structured manner
- View your Services at a glance, understand the services with the highest failure rate, most active services, etc.
Prerequisites
Ensure that you have enabled the following feature flags in the same order:
- TIME_SCALE_CG_SYNC
- CUSTOM_DASHBOARDS_V2
Contact Harness Support to enable the feature.
Step: View Services Dashboard
Perform the following steps to view CG Dashboard:
-
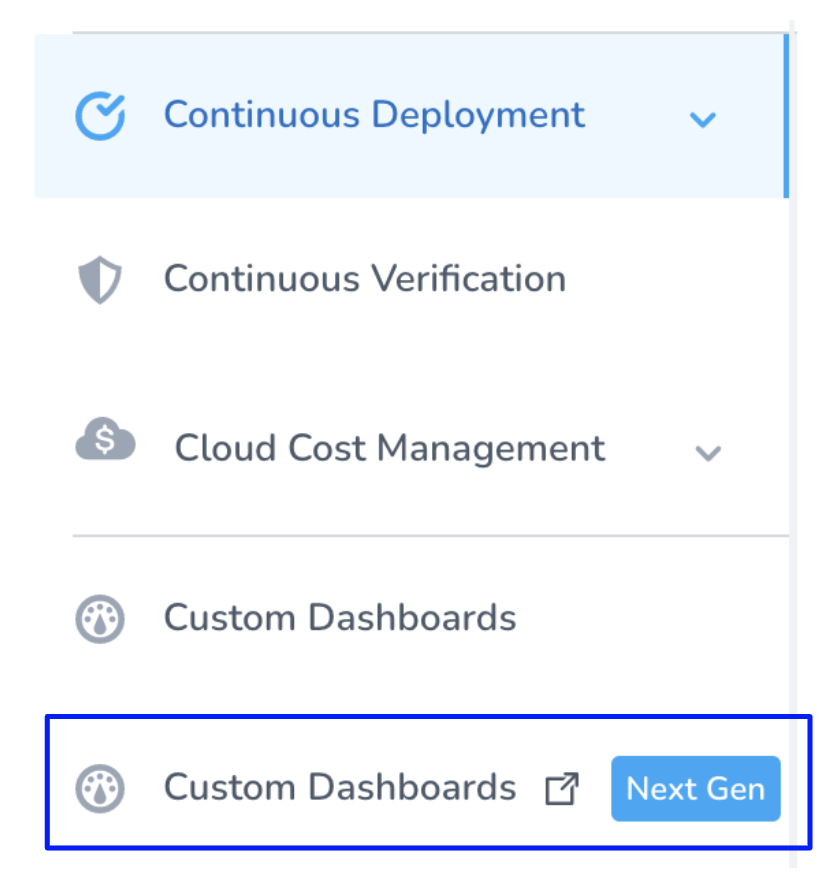
In Harness First Generation, click Custom Dashboards Next Gen.
-
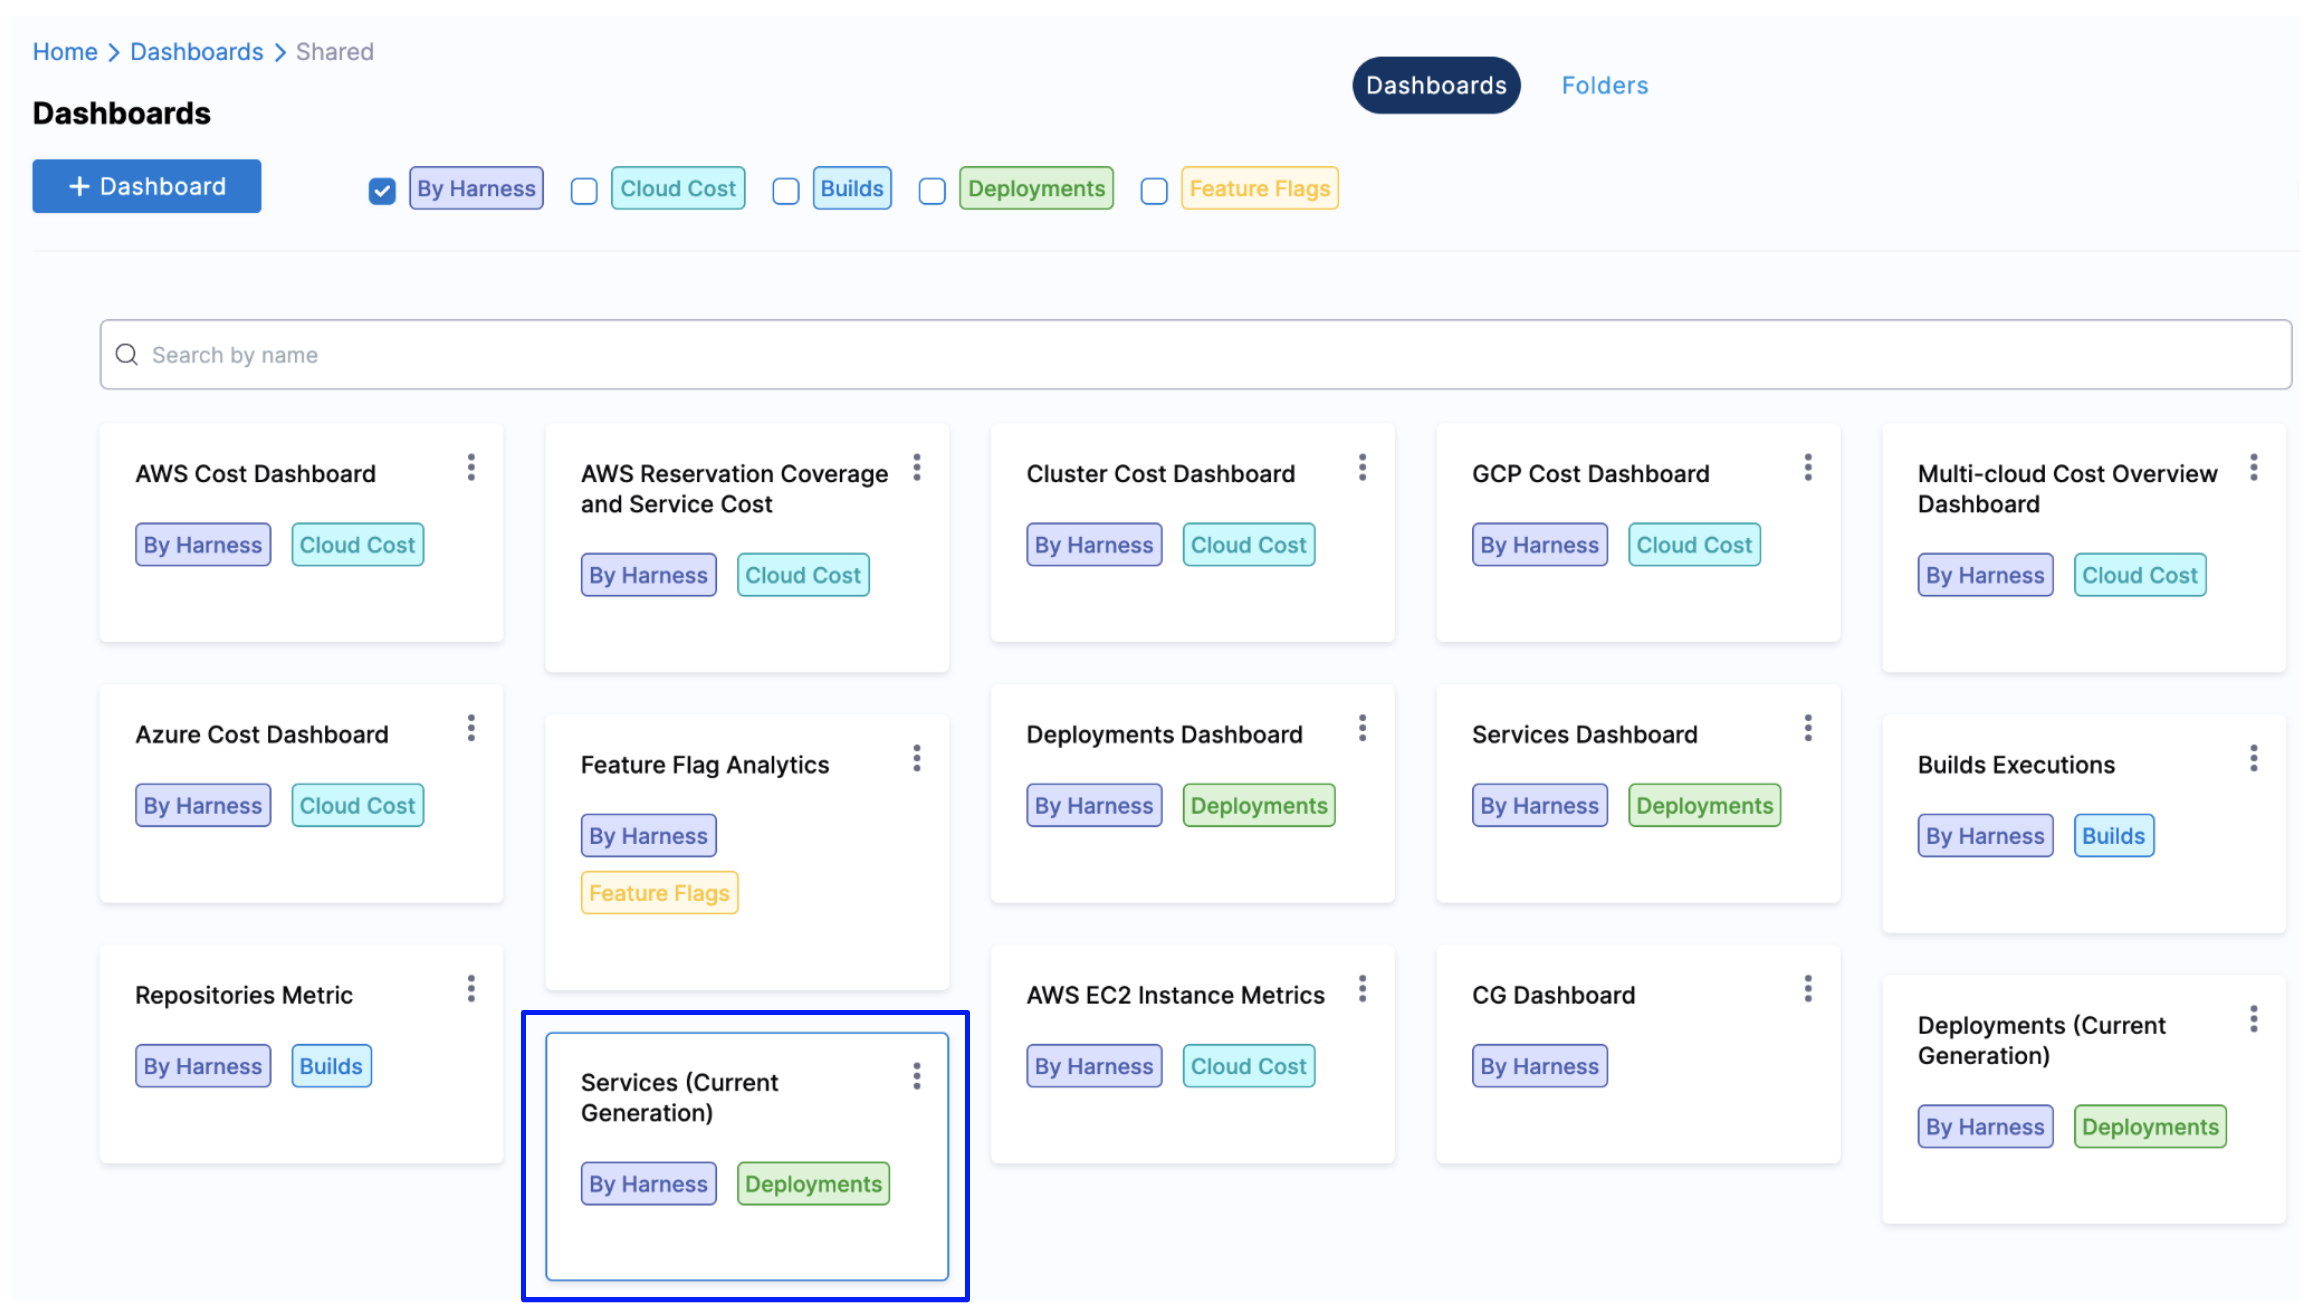
In Dashboards, select By Harness and click Services (FirstGen) Dashboard.
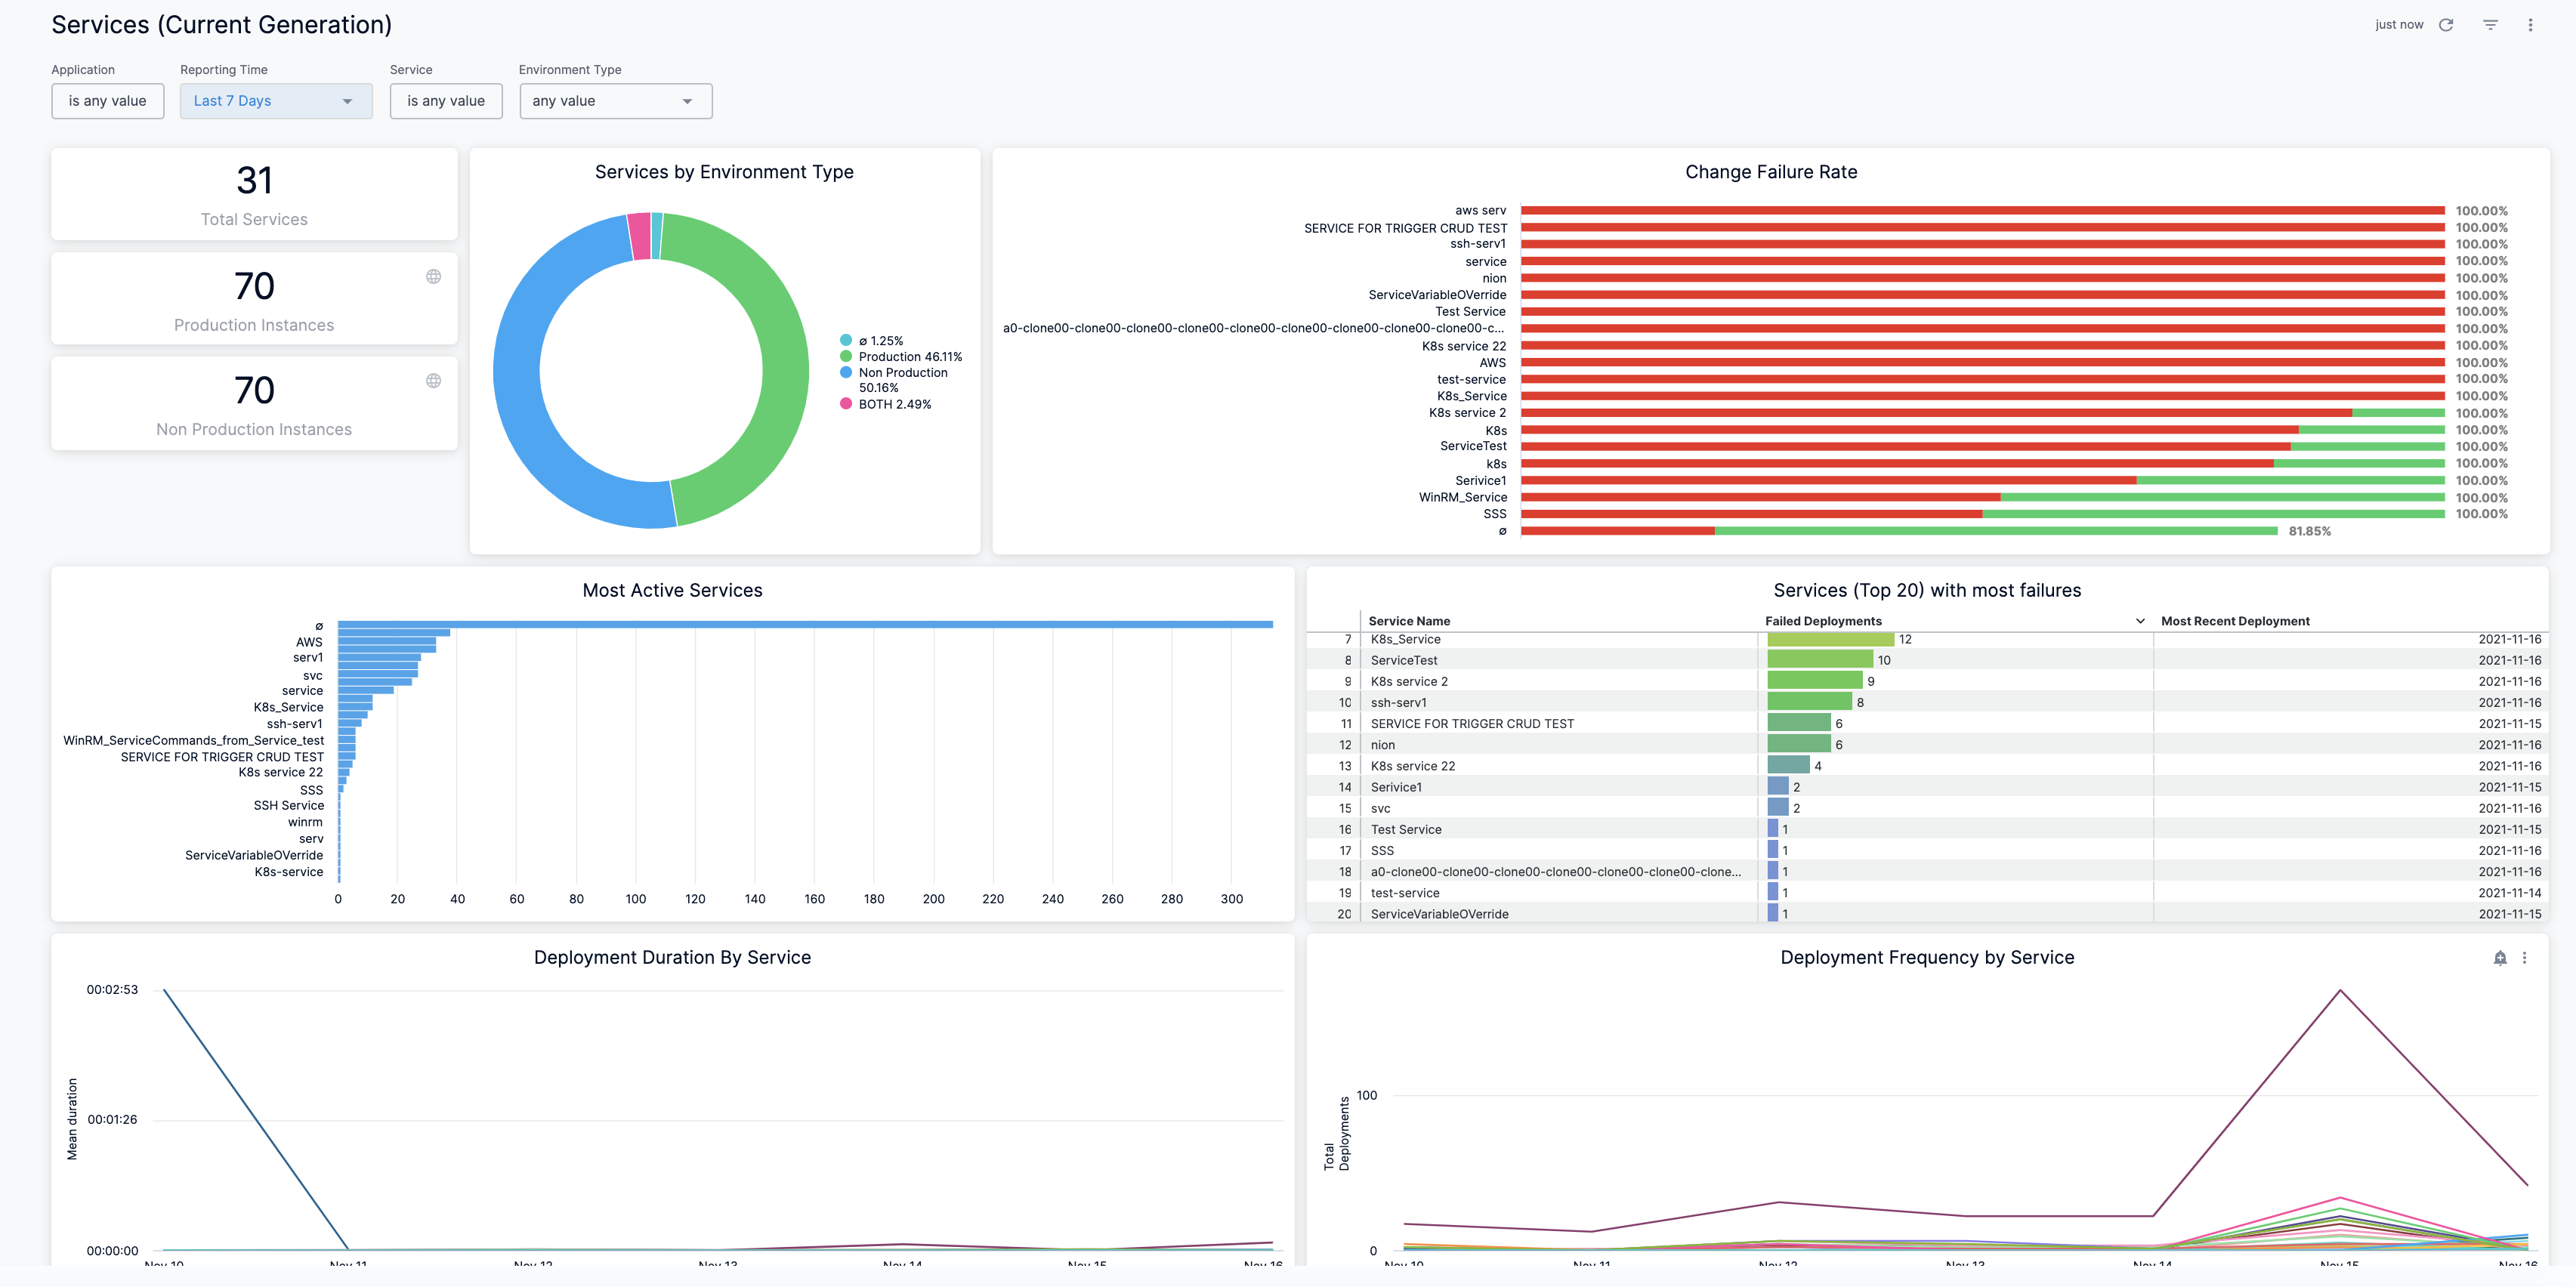
The Services (FirstGen) Dashboard is displayed.
-
In Application, select the Application(s) for which you want to view and analyze the data.
-
Select Reporting Period to filter the data based on pre-defined time range filters. The available filters are:
- Last 1 Day
- Last 7 Days
- Last 30 Days
- Last 90 Days
- Last year
-
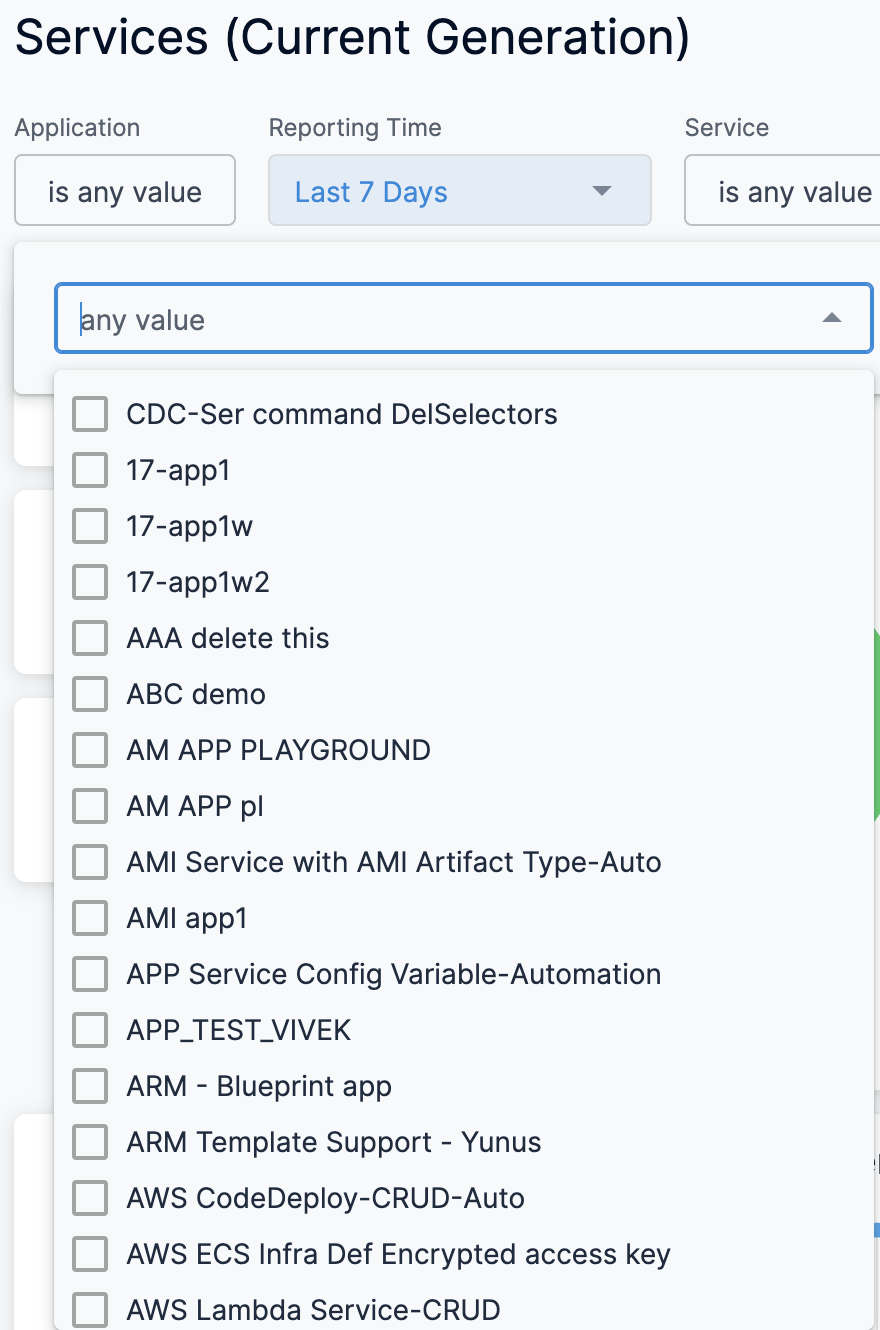
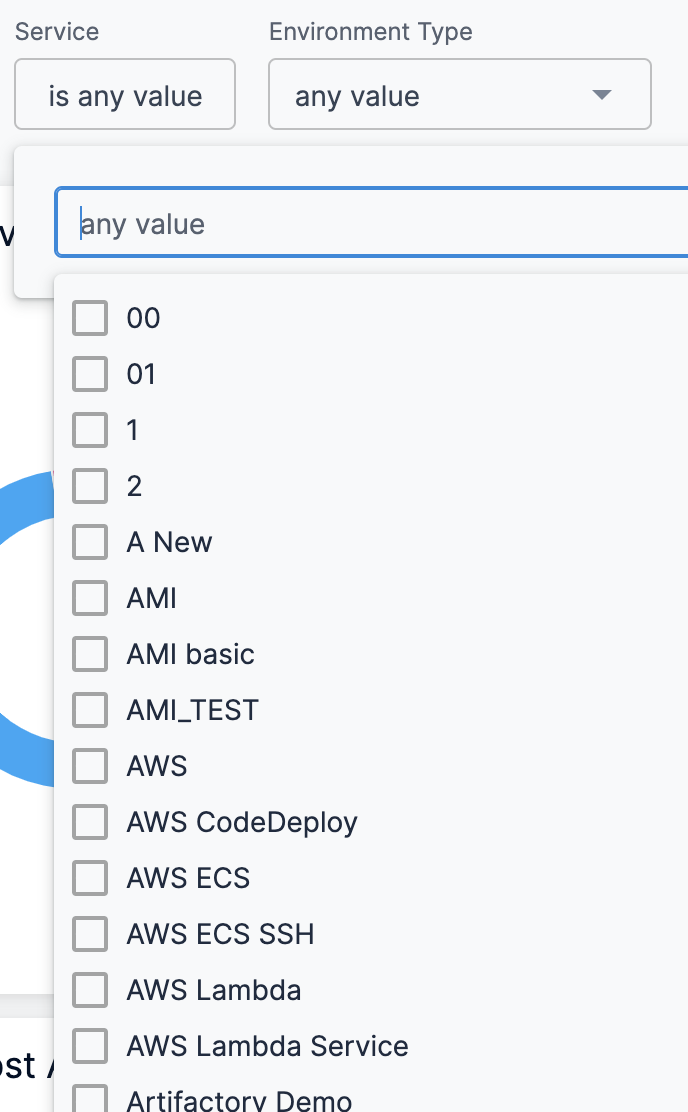
In Service, select the Service(s) for which you want to view and analyze the data.
-
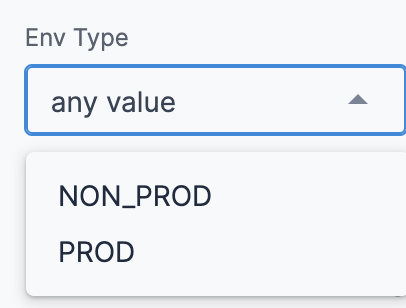
In Env Type, select the environment where your applications and services are hosted.
-
Once you have made all your selections, click Update. The data is refreshed with the latest data from the database.

-
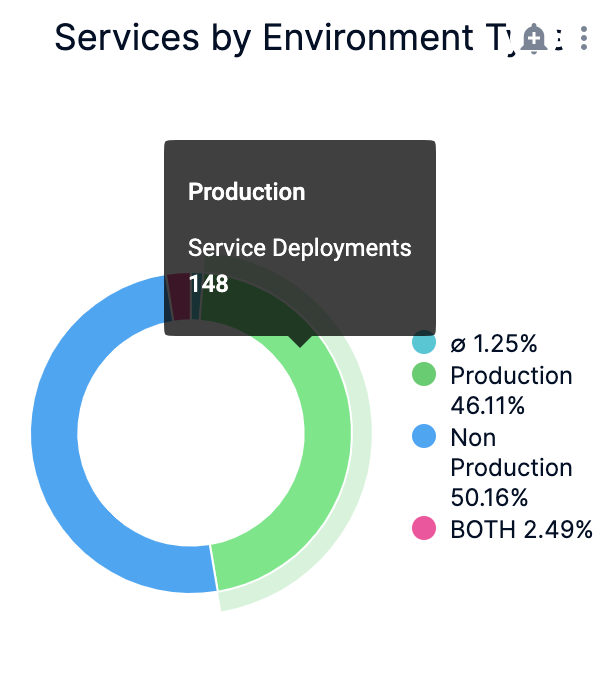
Hover on the Services by Environment Type chart to see the Service deployments details.
-
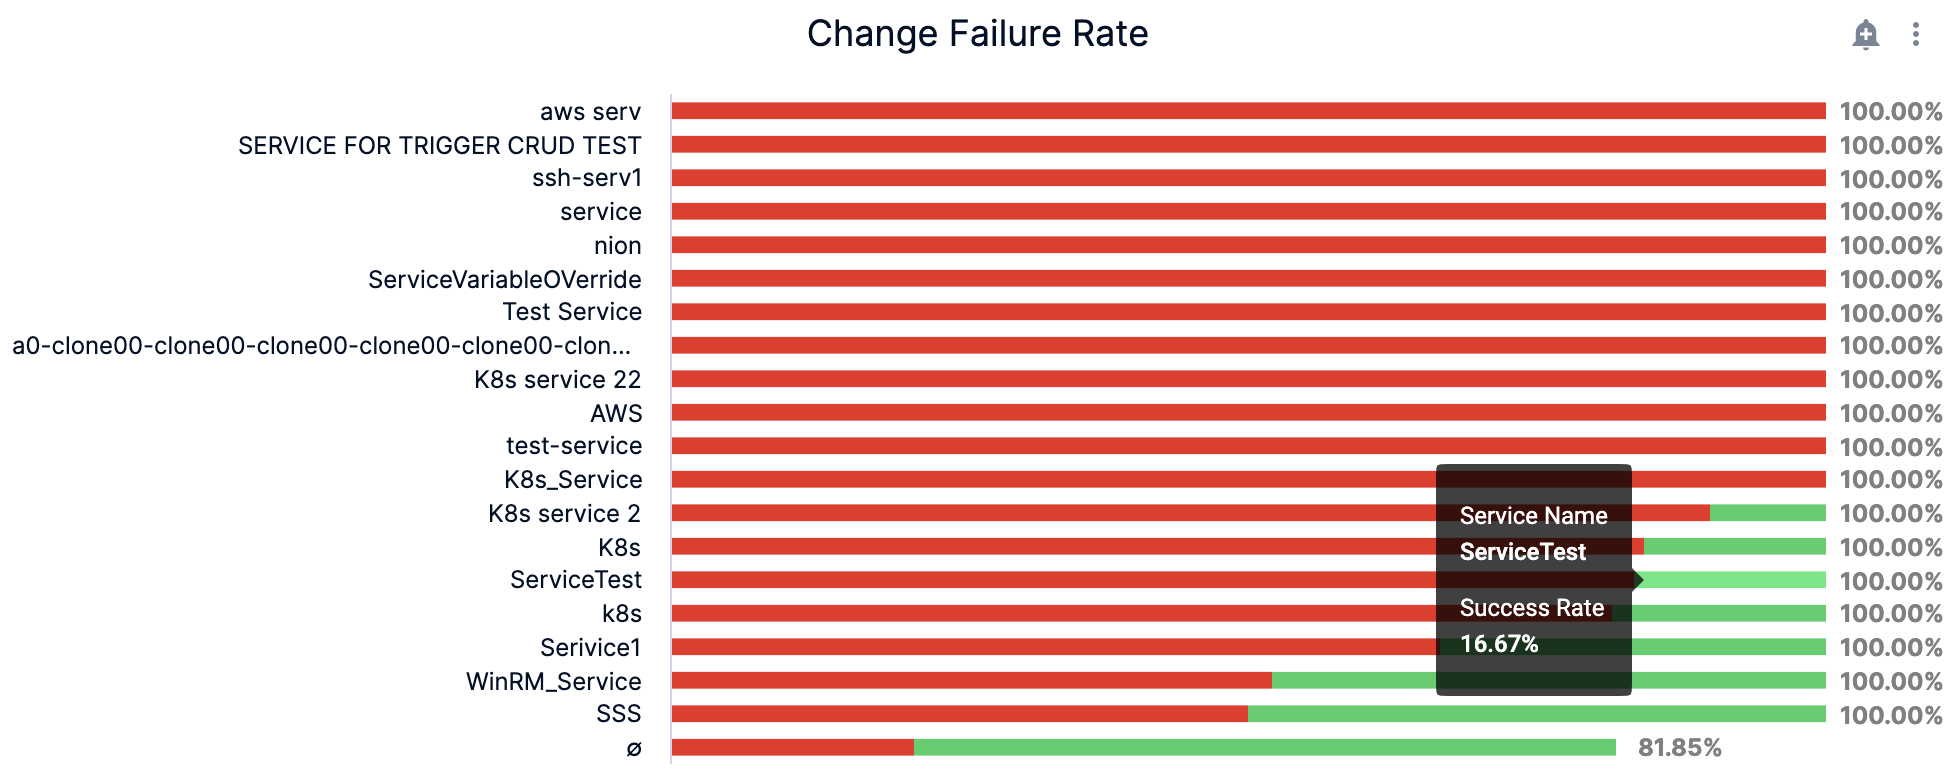
In Change Failure Rate, hover on the chart to view the service and its failure rate details.
-
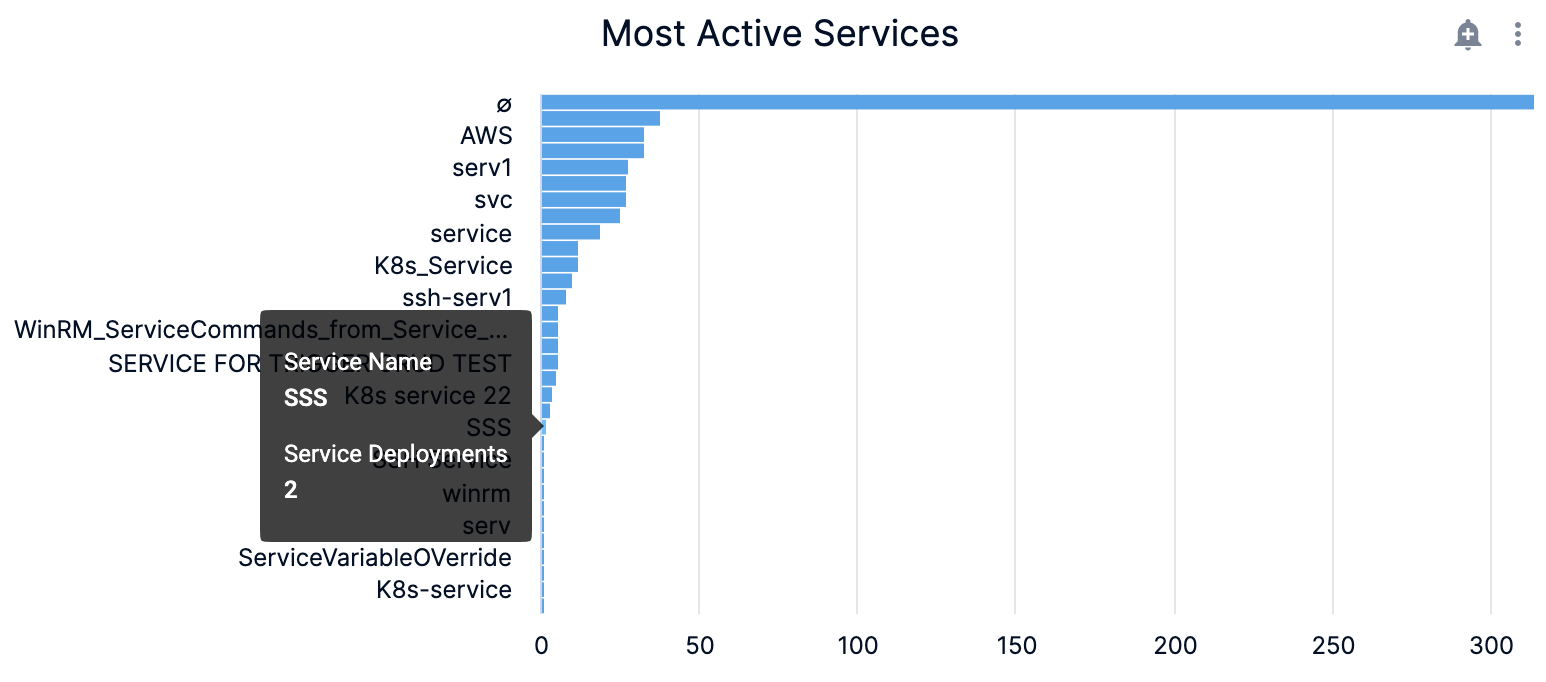
In Most Active Services, hover on the chart to view the service and the service deployments details.
-
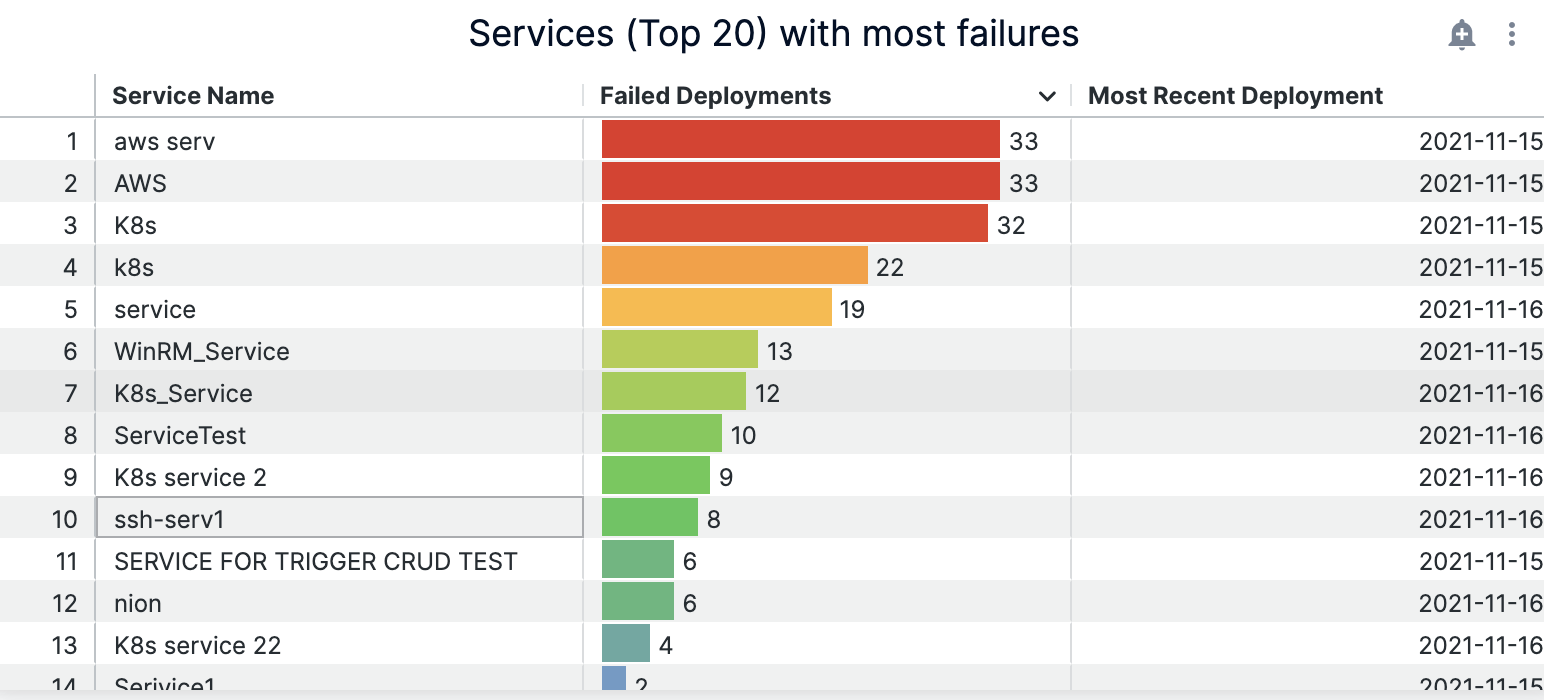
In Services (Top 20) with most failures, view the details of the top 20 services with most failures.
-
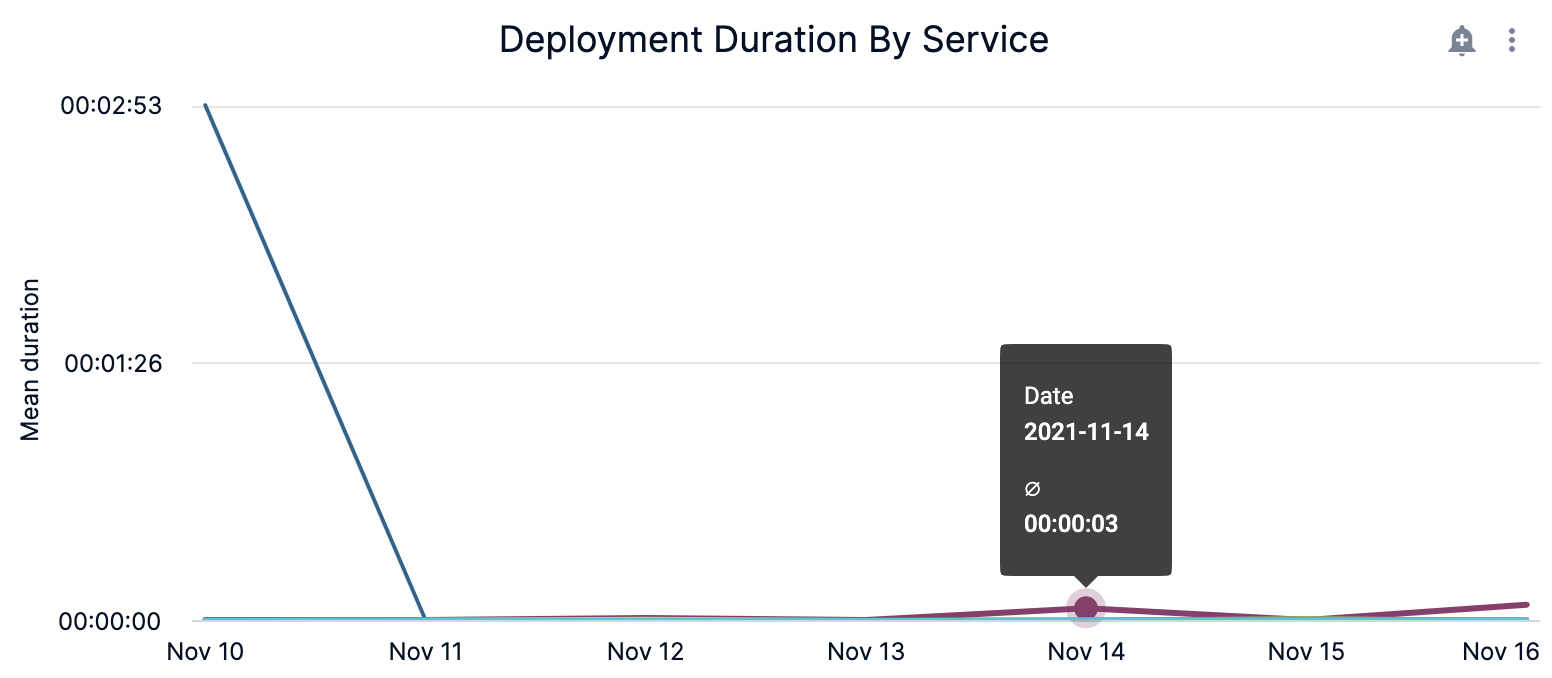
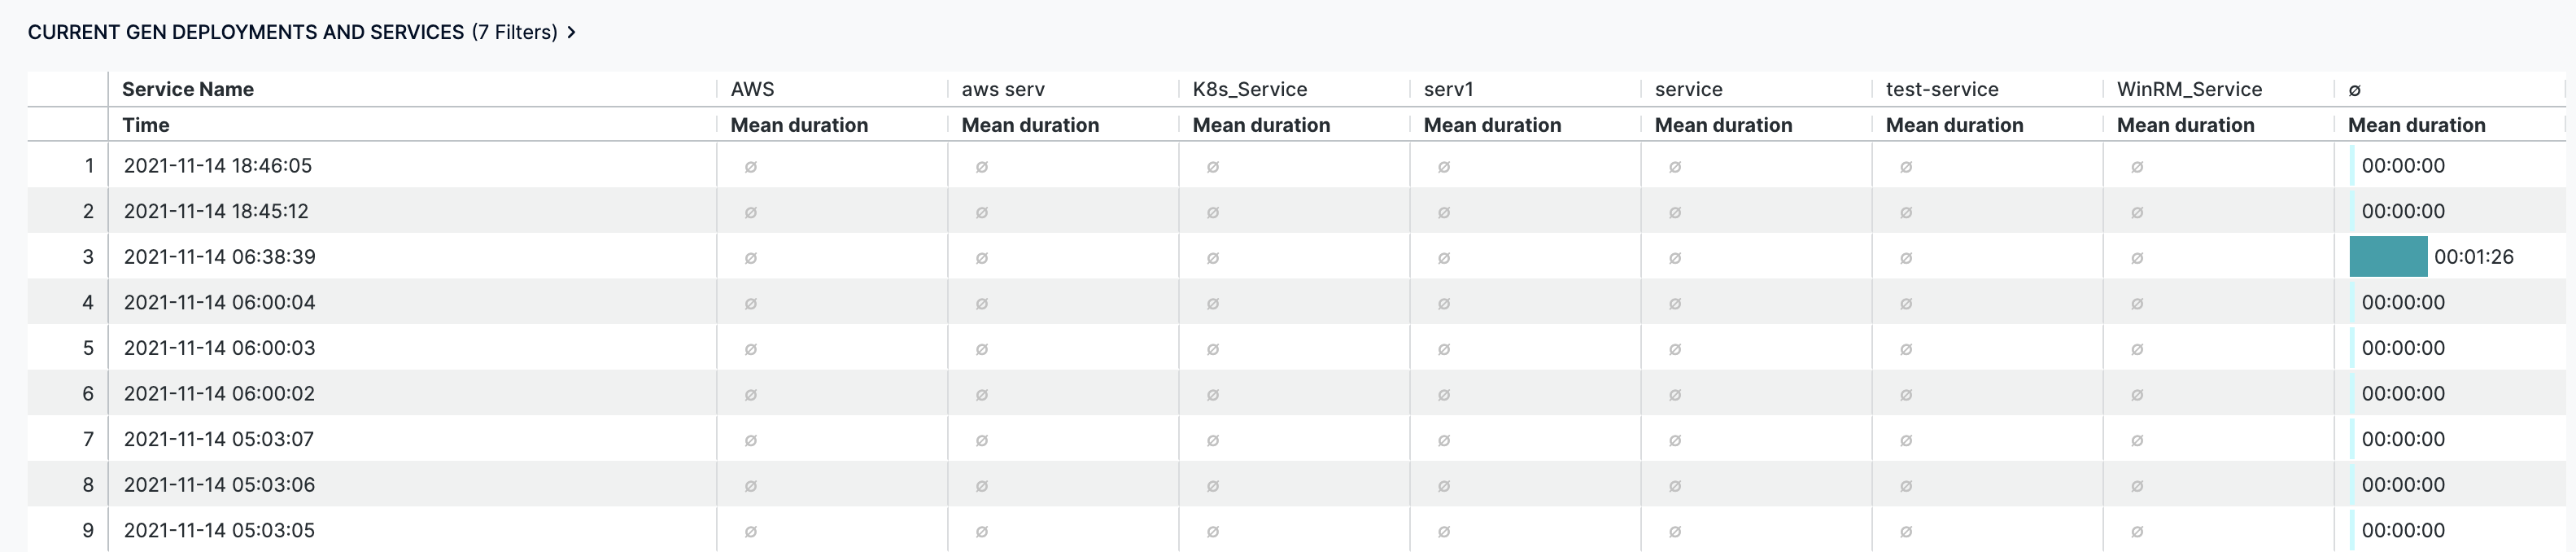
In Deployment Duration By Service, hover on the chart to view the service deployment duration details.
- You can further drill into the service deployment duration details by Time:
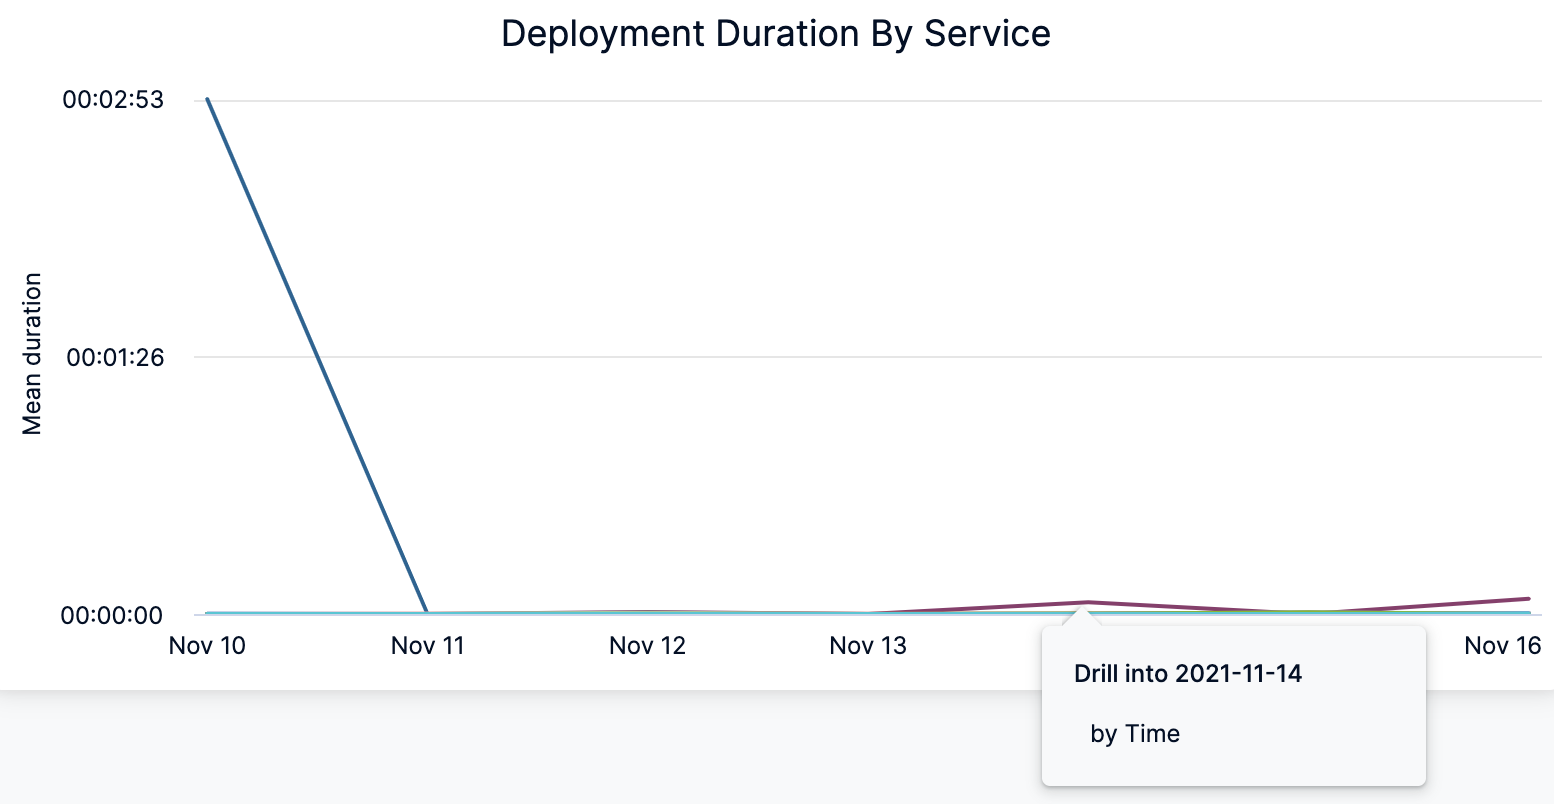
The deployment duration by Service details for the selected time is displayed.
-
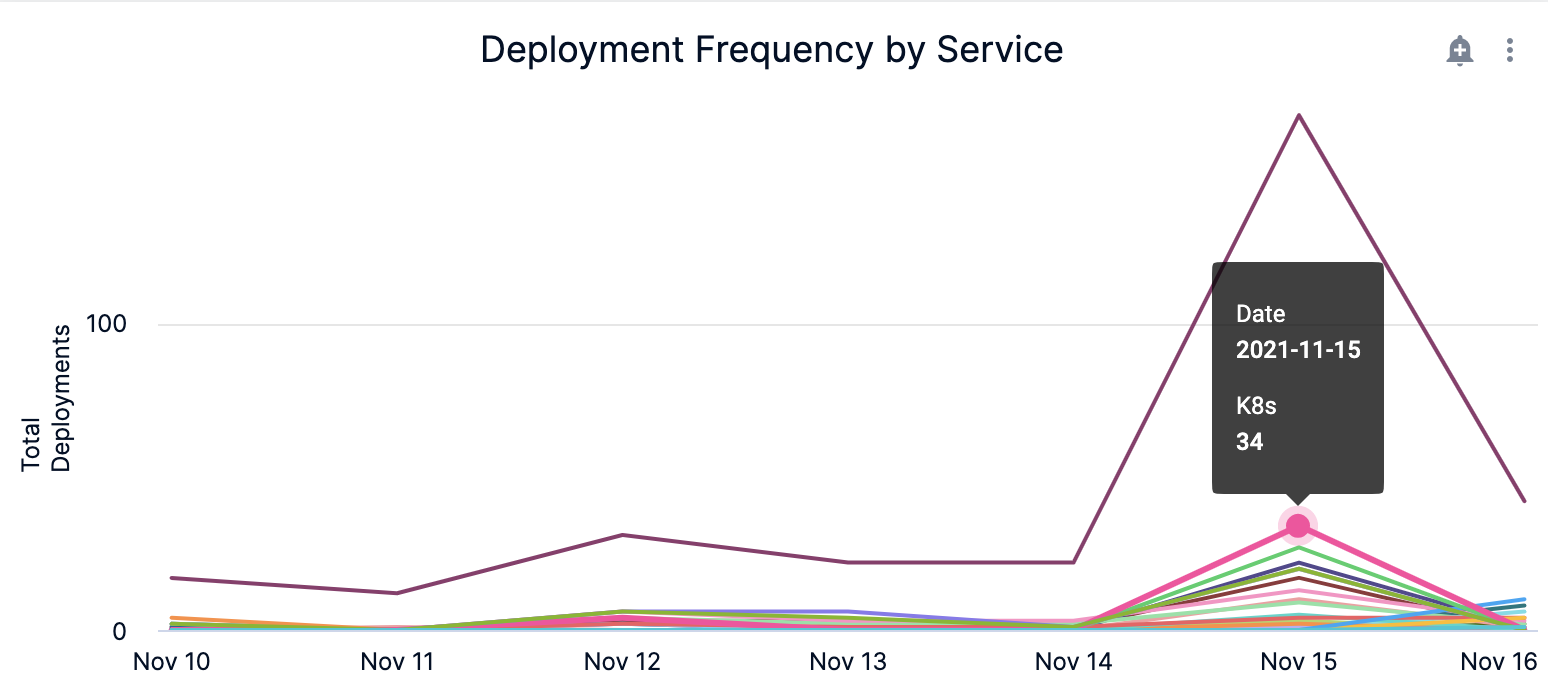
In Deployment Frequency by Service, hover on the chart to view the service deployment frequency details.
-
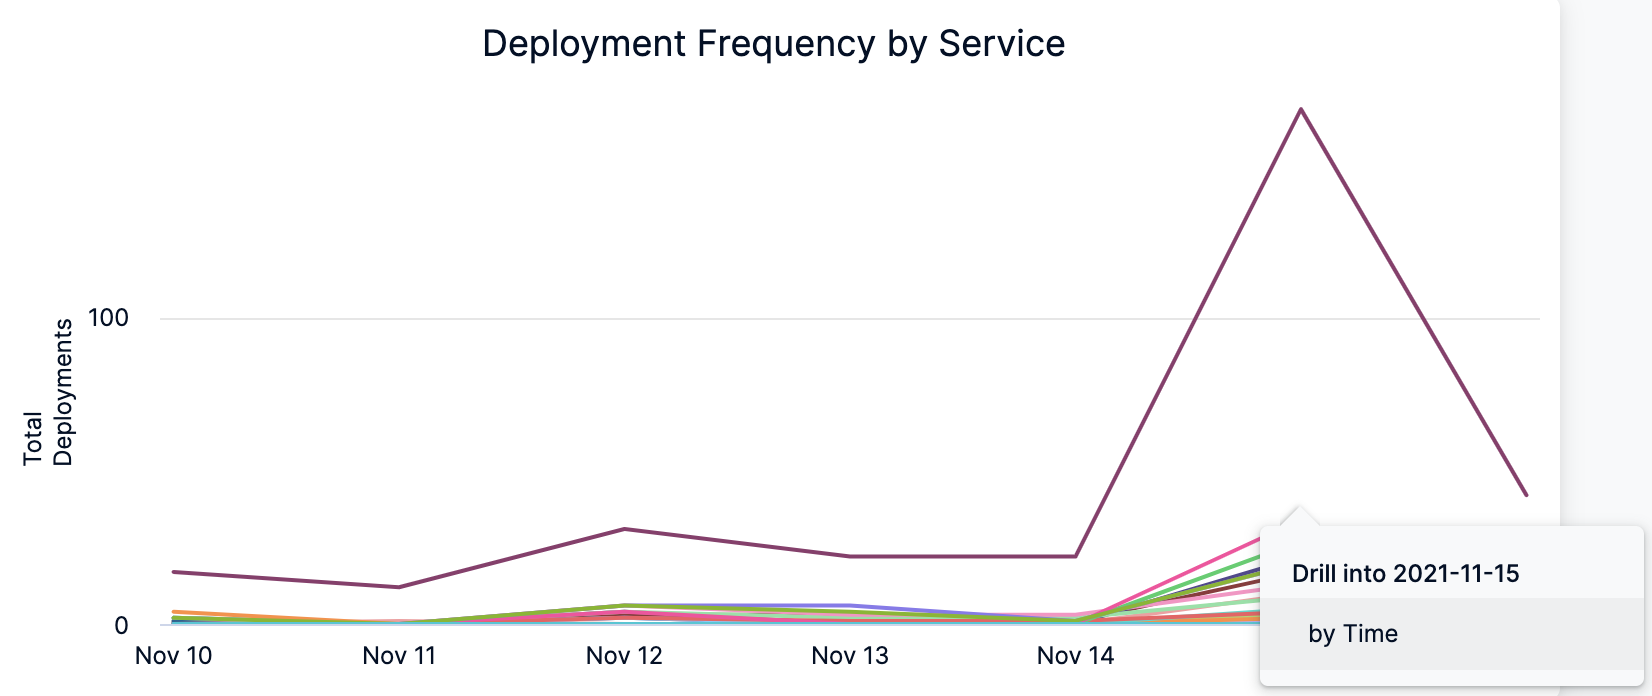
You can further drill into the service deployment frequency details by Time.
Clone a Dashboard
To clone a Dashboard, do the following:
-
In Dashboards, select By Harness and click Services (FirstGen) Dashboard.
-
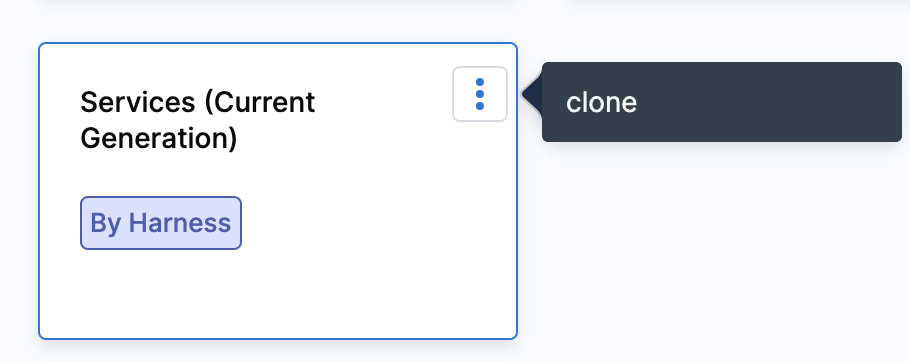
Click the three-dot menu in the upper right of the dashboard and click clone.
See Also
You can also perform the following actions on the Dashboard:
- Use Dashboard Actions
- Download Dashboard Data
- Create Conditional Alerts
- Schedule and Share Dashboards
Next Steps
Refer to the following topics to create your own Dashboard and chart data.