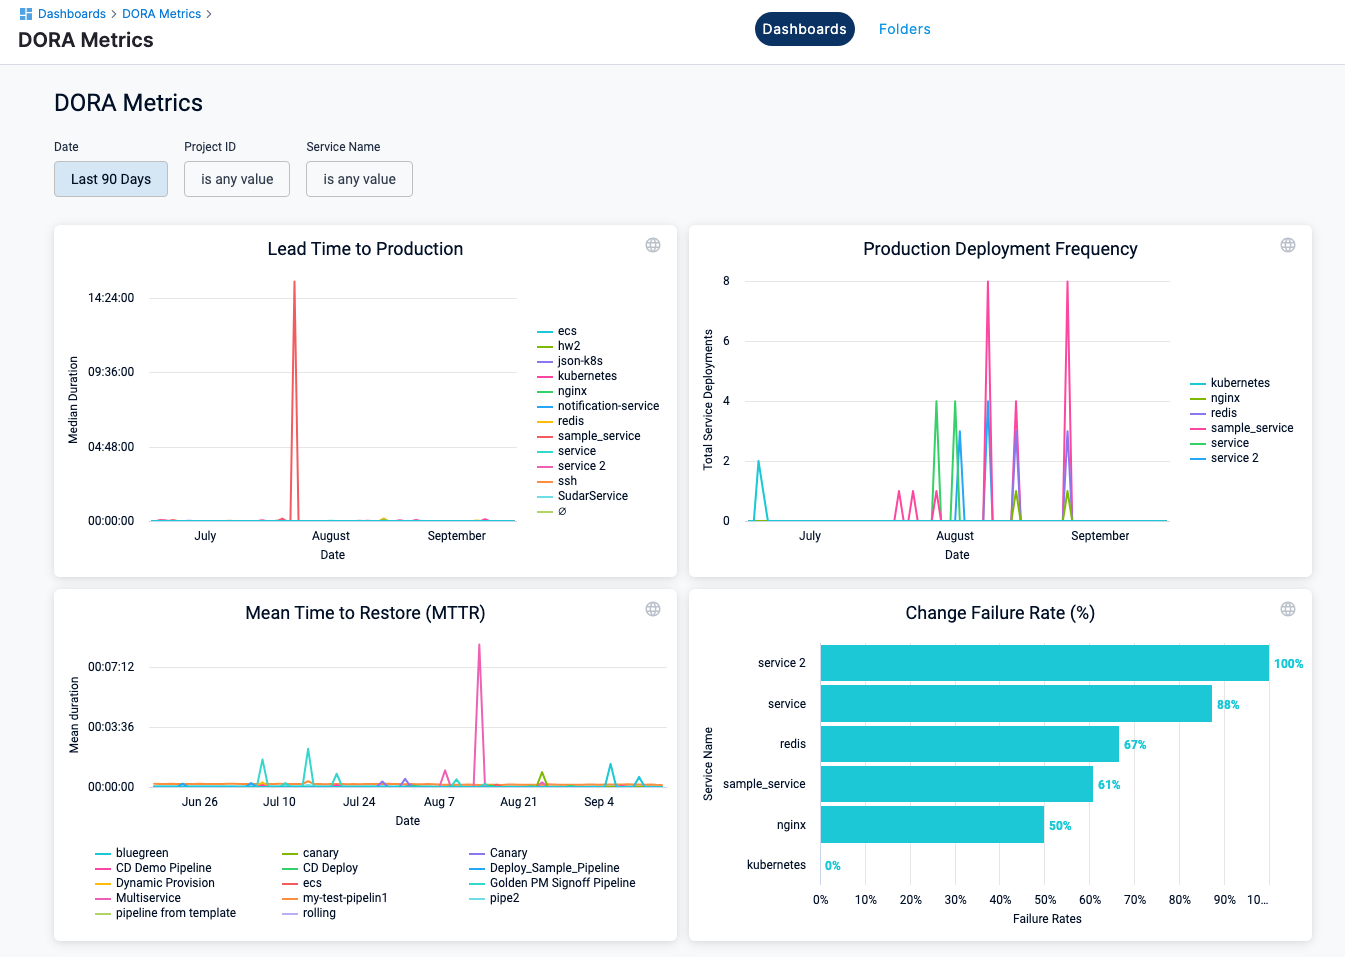
DORA metrics dashboard
DevOps Research and Assessment (DORA) metrics is a standard measure of DevOps performance. By understanding these metrics, you can make informed decisions and implement improvements that can help your business grow.
Create queries to pull data into your DORA dashboard
After you create a DORA metrics dashboard, you can add tiles to the dashboard.
You can edit, delete, resize, move positions, or download data of the tiles.
Using the DORA metrics dashboard, you can view the following metrics.
- Deployments Frequency tells you how many deployments happened in a particular duration. This metric helps measure the consistency of software delivery and delivery performance.
- Mean Time to Restore (MTTR) tells you the time taken to restore an issue found in the production environment.
- Change Failure Rate is the percentage of failure rate across all services in a given time period.
- Lead Time to Production shows the median duration of deployments.
To gain deeper insights, you can create queries in the dashboard to capture data. Harness captures metrics for each service-environment combination within a pipeline. If you have a multi-service pipeline, metrics for each service-environment combination will be captured and reported separately.
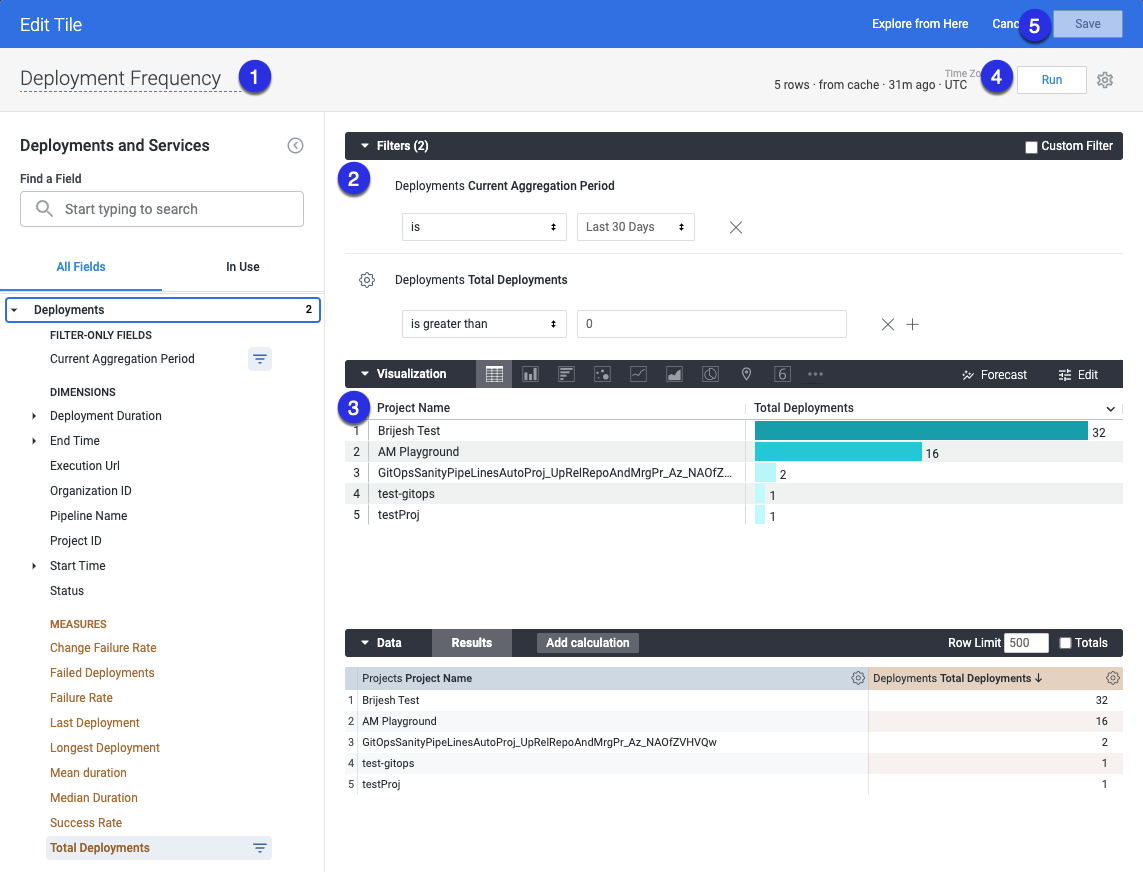
Deployment frequency
- Enter a name your query. For example, Deployment Frequency.
- Select the following filters.
- In Deployments, select Custom Aggregation Period, then select the time period.
- In Deployments, select Total Deployments.
- Configure your visualization options. For more information, go to create visualization and graphs.
- Select Run.
- Select Save to save the query as a tile on your dashboard.
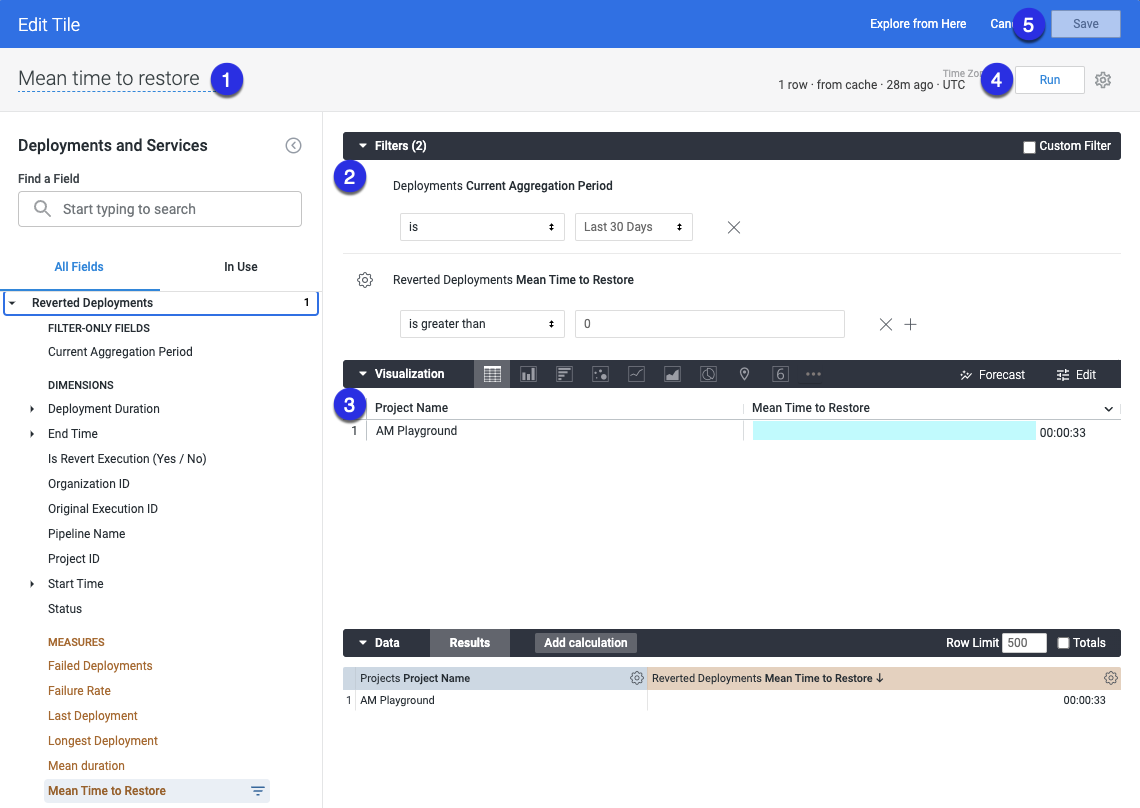
Mean time to restore
- Enter a name your query. For example, Mean Time to Restore.
- Select the following filters.
- In Deployments, select Custom Aggregation Period, then select the time period.
- In Reverted Deployments, select Mean Time to Restore.
- Configure your visualization options. For more information, go to create visualization and graphs.
- Select Run.
- Select Save to save the query as a tile on your dashboard.
Use reverted executions to capture mean time to restore
Currently, Harness does not measure regressions or failures that occur after a production deployment is complete.
During the pipeline deployment, if there is an issue that causes downtime, a reverted pipeline execution can restore the service.
You can mark a pipeline execution as a restored/reverted pipeline and link it to the pipeline execution that introduced the issue.
You can then use the difference between the end time of the parent execution and the end time of the reverted execution to capture mean time to restore.
To have a failed pipeline execution revert automatically, when you create a new pipeline stage, create a custom variable, and add the following tag with an expression to call the variable.
Here's a sample revert_execution_id_var variable :
  variables:
    - name: revert_execution_id_var
      type: String
      description: ""
      required: false
      value: <+input>
In the pipeline YAML, you can add the following sample expression as a tag to call the variable:
tags:
  revert_execution_id: <+pipeline.variables.revert_execution_id_var>
Below is an example of a pipeline execution. The revert_execution_id tag represents the execution Id of the pipeline that caused the issue.
pipeline:
  identifier: "DOra_pipeline"
  tags:
    revert_execution_id: "Q0bizp0QTM6xtB1FZsR0zQ"
  stages:
  - stage:
      identifier: "stage1"
      type: "Deployment"
      spec:
        service:
          serviceRef: "Ser2"
        environment:
          environmentRef: "Env2"
          infrastructureDefinitions:
          - identifier: "Infra_2"
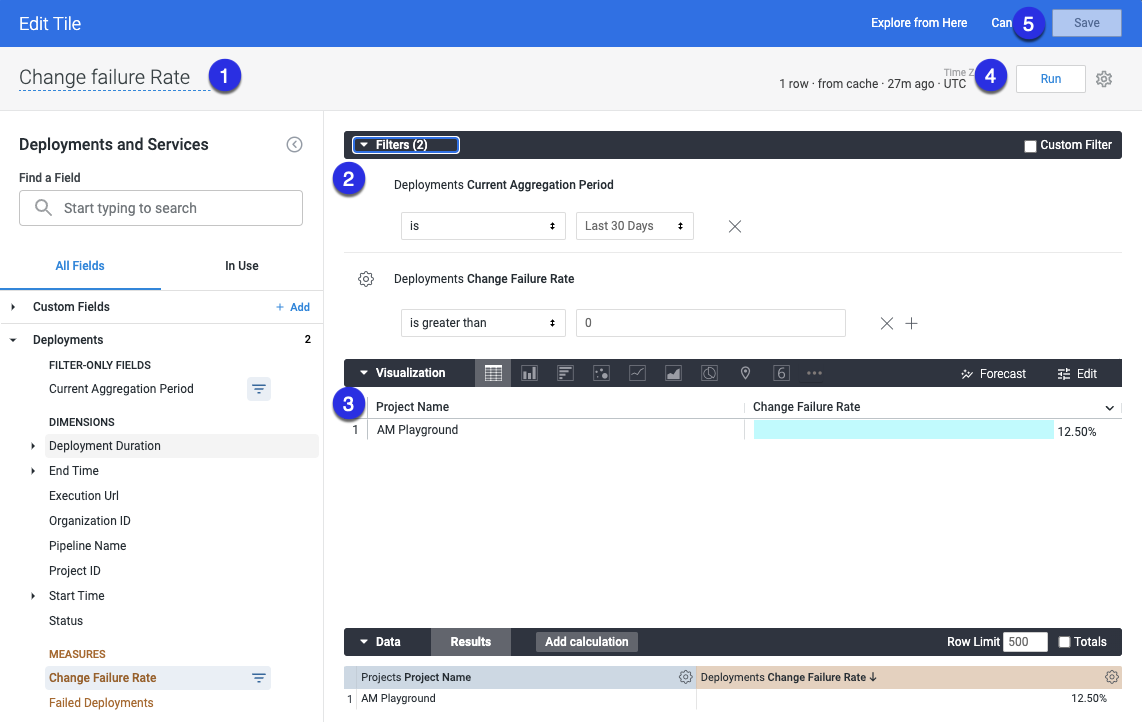
Change failure rate
- Enter a name your query. For example, Change Failure Rate.
- In Deployments, select Custom Aggregation Period, then select the time period.
- In Deployments, select Change Failure Rate.
- Configure your visualization options. For more information, go to create visualization and graphs.
- Select Run.
- Select Save to save the query as a tile on your dashboard.
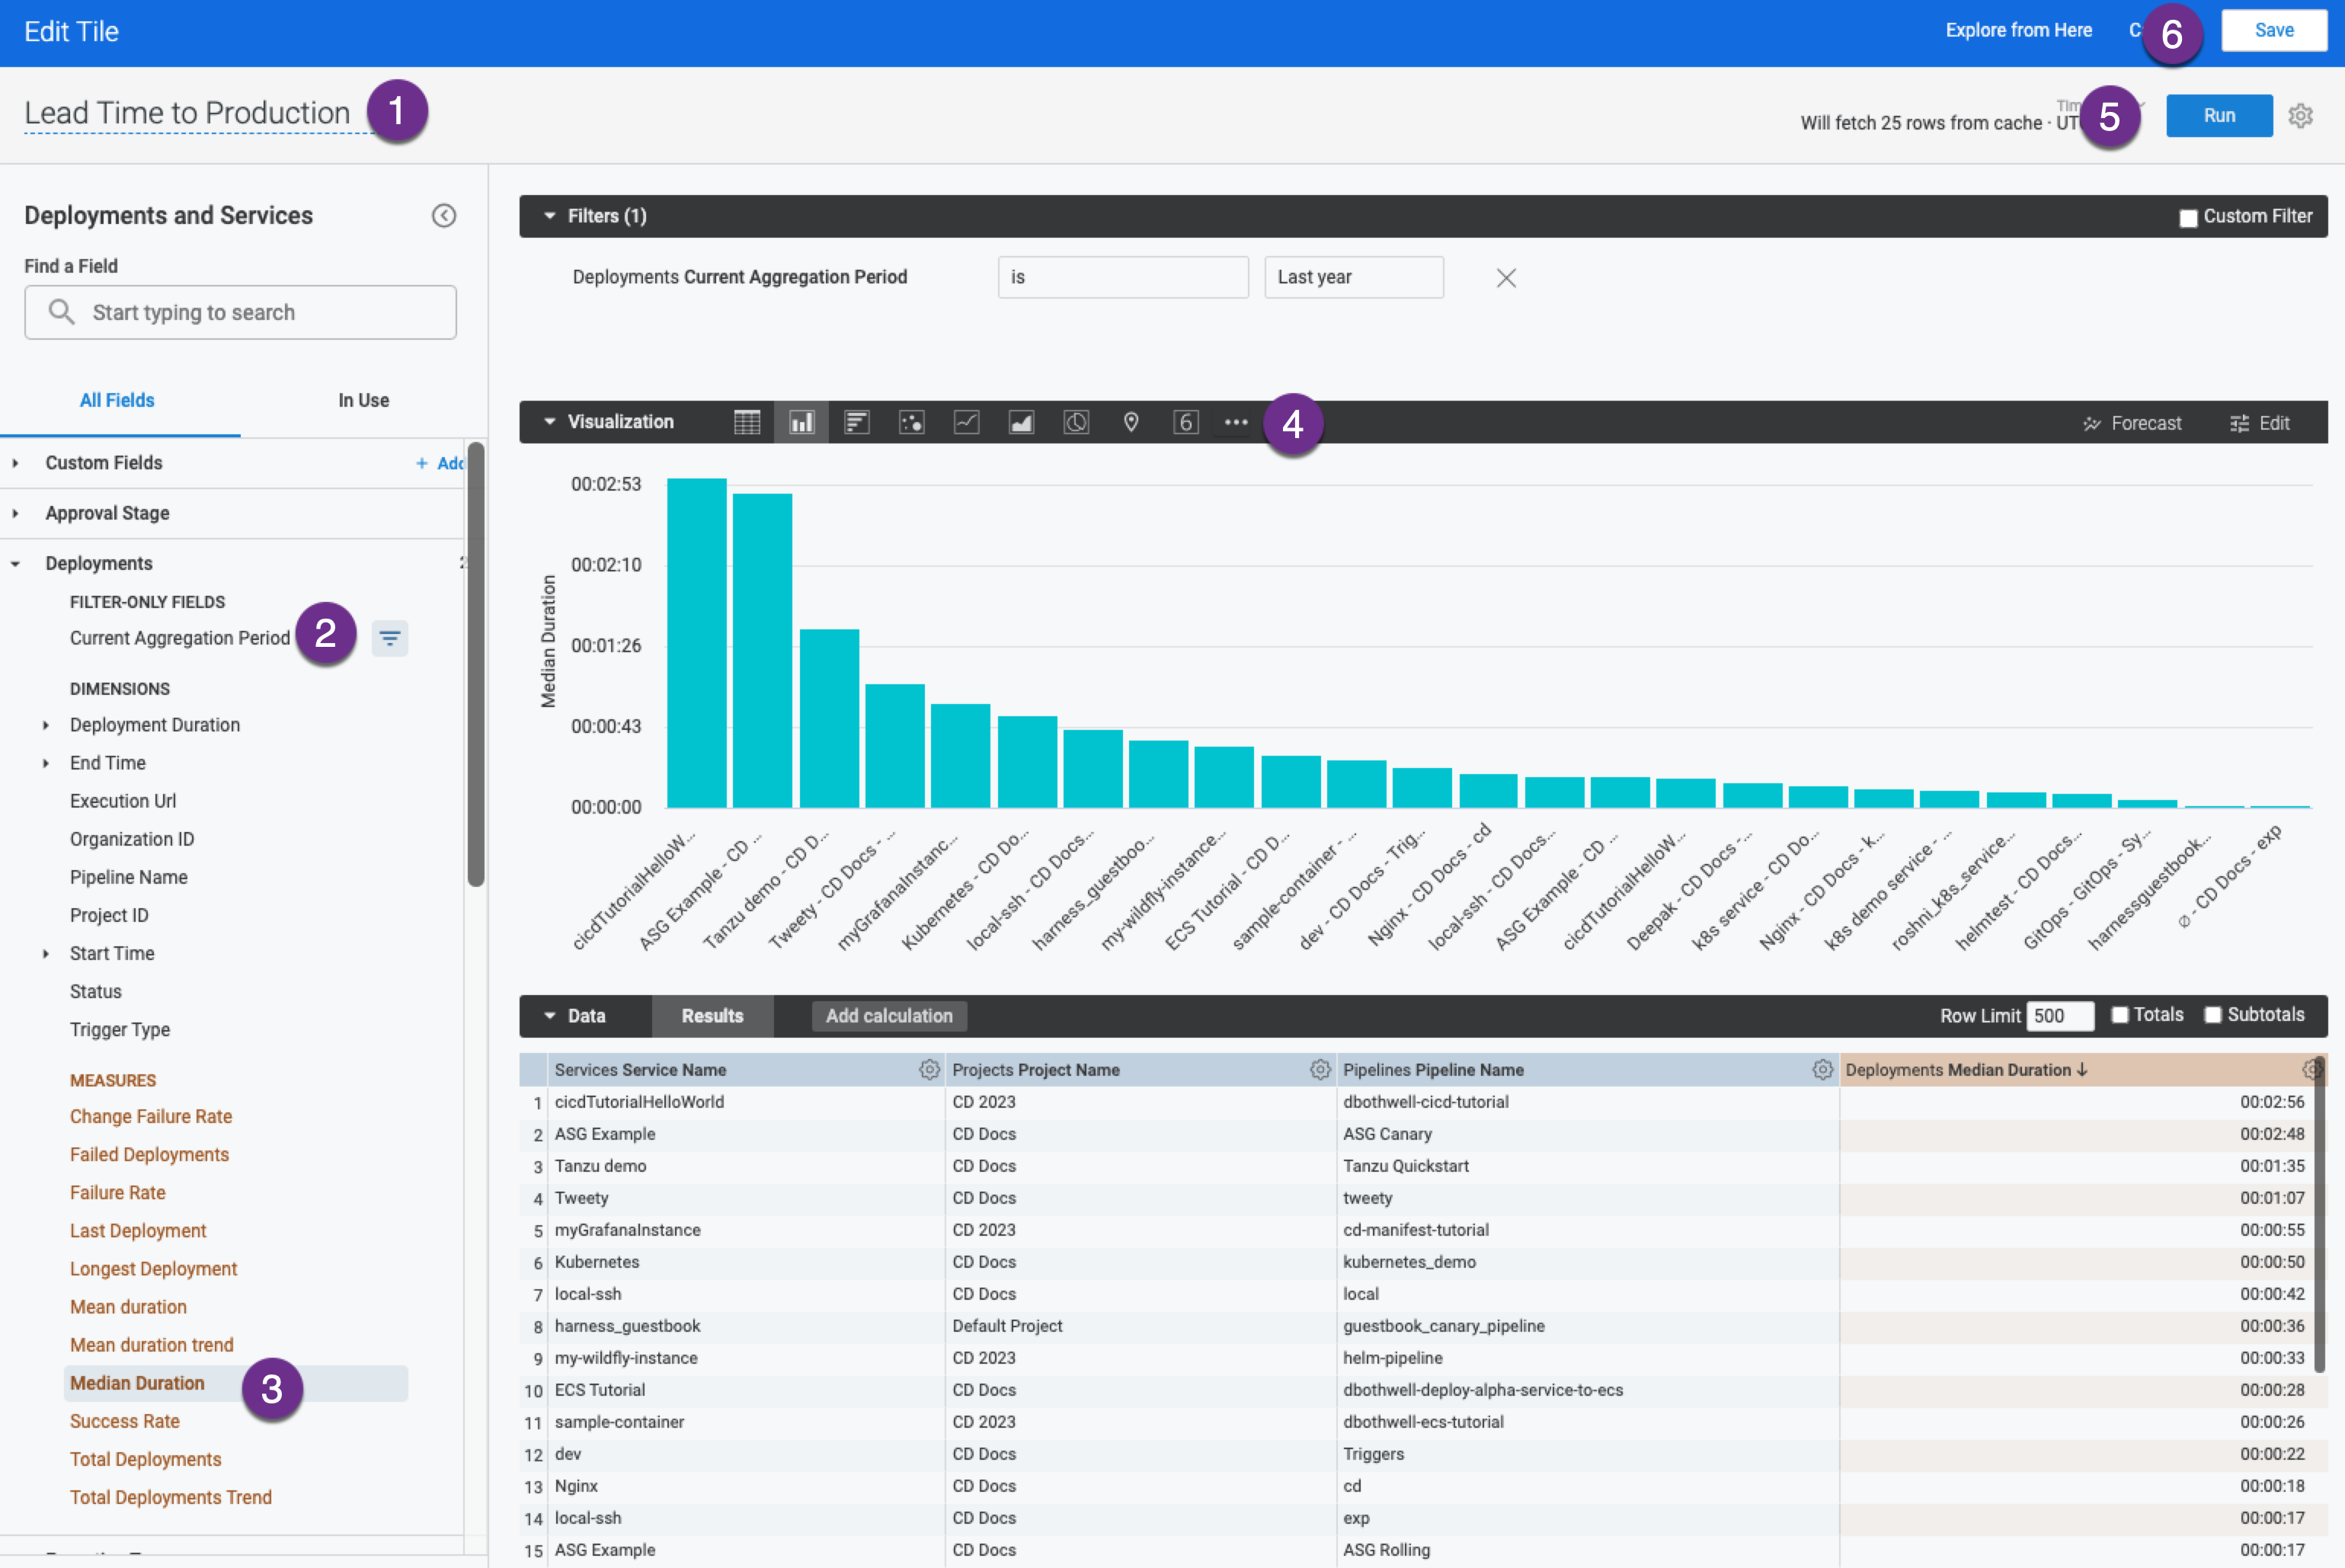
Lead time to production
Lead Time to Production shows the median duration of deployments.
- Enter a name for your query. For example, Lead Time to Production.
- In Deployments, select Custom Aggregation Period, then select the time period.
- In Deployments, select Median Duration.
- Configure your visualization options. For more information, go to create visualization and graphs.
- Select Run.
- Select Save to save the query as a tile on your dashboard.