Elasticsearch
Harness Continuous Verification (CV) integrates with Elasticsearch to:
- Verify that the deployed service is running safely and performing automatic rollbacks.
- Apply machine learning to every deployment to identify and flag anomalies in future deployments.
This topic describes how to set up an Elasticsearch health source when adding a CV step to your Continuous Deployment (CD).
-
Harness only supports the Lucene query language.
-
Use the Java-supported format when specifying dates in a query.
Prerequisite
Elasticsearch is added as a verification provider in Harness.
Set up continuous verification
To set up CV, you will need a Harness Monitored Service. In the simplest terms, a Monitored Service is basically a mapping of a Harness Service to a service monitored by your APM or logging tool.
You can set up a Monitored Service in the Verify step in a CD stage.
There are other ways to set up a Monitored Service. To learn more see: Monitored Service
In this topic we'll set up the Monitored Service as part of the Verify step.
Add Verify Step
To add a Verify step to your pipeline, use one of the methods below.
Add a Verify step while building a deployment stage
If you're building a deployment stage and currently on the Execution Strategies page:
-
Select the Enable Verification option.
The Verify step gets added to the pipeline.
-
Select the Verify step.
The Verify settings page appears.
Add a Verify step to an existing deployment stage
If you already have a deployment stage:
-
Select the stage where you want to add the Verify step.
-
On the stage settings pane, select the Execution tab.
-
On the pipeline, hover over where you want the Verify step, select the + icon, and then choose Add Step.
The Step Library page appears. You can add a step at various points in the pipeline such as the beginning, end, in between existing steps, or below an existing step. Simply choose the location where you want to add the step and follow the prompts to add it.
-
In the Continuous Verification section, select Verify.
The Verify settings page appears.
Define name and time out information
-
In Name, enter a name for the Verification step.
-
In Timeout, enter a timeout value for the step. Harness uses this information to time out the verification. Use the following syntax to define timeout:
- w for weeks. For example, to define one week, enter 1w.
- d for days. For example, to define 7 days, enter 7d.
- h for hours. For example, to define 24 hours, enter 24h.
- m for minutes, For example, to define 100 minutes, enter 100m.
- s for seconds. For example, to define 500 seconds, enter 500s.
- ms for milliseconds. For example, to define 1000 milliseconds, enter 1000ms.
-
The maximum timeout value you can set is 53w. You can also set timeouts at the pipeline level.
Node filtering
Currently, this feature is behind the feature flag CV_UI_DISPLAY_NODE_REGEX_FILTER. Contact Harness Support to enable the feature.
The node filtering feature allows you to select specific nodes within your Kubernetes environment using the PodName label. This allows for focused analysis, enabling you to choose specific nodes as service instances for in-depth analysis.
Harness CV autonomously identifies new nodes as they are added to the cluster. However, the node filtering feature allows you to focus the analysis explicitly on the nodes that you want to analyze. Imagine you have a Kubernetes cluster with multiple nodes, and you want to analyze the performance of pods running on specific nodes. You want to analyze the nodes that match a certain naming pattern.
Procedure:
-
On the Verify settings page, expand Optional to navigate to the node filtering settings section.
-
(Optional) Select Use node details from CD if you want Harness CV to collect and analyze the metrics and log details for the recently deployed nodes.
-
Specify the Control Nodes and Test Nodes:
-
Control Nodes: These are the nodes against which the test nodes are compared. You can specify the control nodes to provide a baseline for analysis.
-
Test Nodes: These are the nodes that Harness CV evaluates and compares against the control nodes.
To specify the Control Nodes and Test Nodes, in one of the following ways:
-
Type node names: Enter the names of specific nodes you want to include in the analysis.
-
Use simple patterns (Regex): Define a regular expression pattern to match the nodes you want to filter. For example, if your nodes follow a naming convention such as "node-app-1", "node-app-2", and so on, you could use a pattern such as "node-app-*" to include all nodes with names starting with "node-app-".
Example: Let's say you want Harness CV to analyze the only nodes that have "backend" in their PodName label:
-
In the Control Nodes field, enter "backend-control-node" as the control node.
-
In the Test Nodes field, enter the pattern "backend-*" to include all nodes with names starting with "backend-".
-
Select a continuous verification type, sensitivity, and duration
-
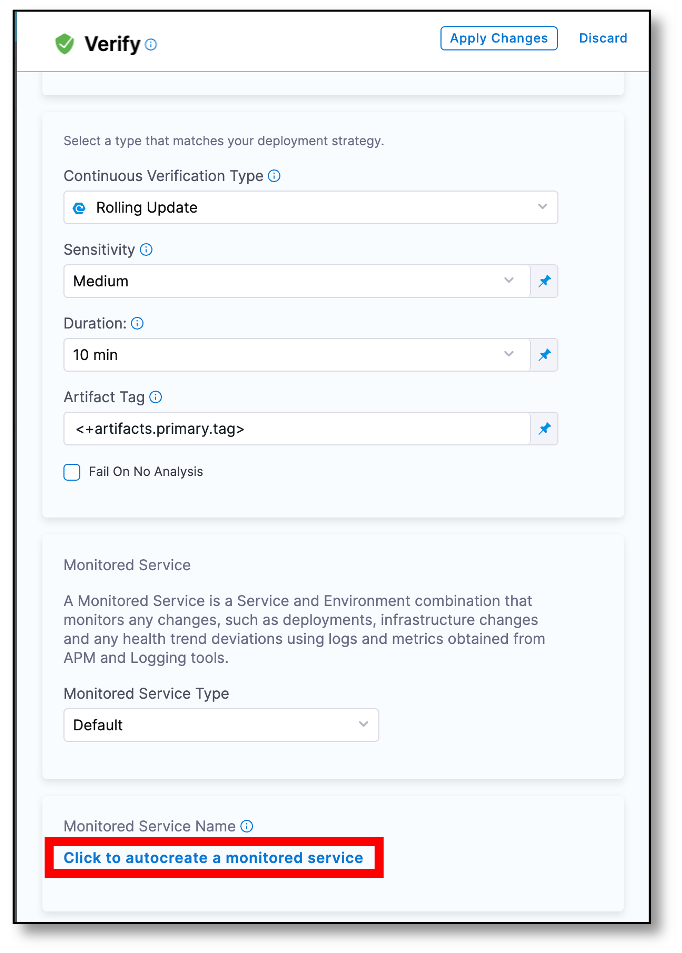
In Continuous Verification Type, select a type that matches your deployment strategy. The following options are available:
-
Auto: Harness automatically selects the best continuous verification type based on the deployment strategy.
-
Rolling Update: Rolling deployment is a deployment technique that gradually replaces old versions of a service with a new version by replacing the infrastructure on which the service runs. Rolling updates are useful in situations where a sudden changeover might cause downtime or errors.
-
Canary: Canary deployment involves a two-phased deployment. In phase one, new pods and instances with the new service version are added to a single environment. In phase two, a rolling update is performed in the same environment. Canary deployment helps to detect issues with the new deployment before fully deploying it.
-
Blue Green: Blue-green deployment is a technique used to deploy services to a production environment by gradually shifting user traffic from an old version to a new one. The previous version is referred to as the blue environment, while the new version is known as the green environment. Upon completion of the transfer, the blue environment remains on standby in case of a need for rollback or can be removed from production and updated to serve as the template for future updates.
-
Load Test: Load testing is a strategy used in lower-level environments, such as quality assurance, where a consistent load is absent and deployment validation is typically accomplished through the execution of load-generating scripts. This is useful to ensure that the application can handle the expected load and validate that the deployment is working as expected before releasing it to the production environment. When you choose "Load Test," you must also choose one of these options:
- Last Successful Job Run: Compare the test data with the data from the previous successful verification. Set successful verification as a baseline for load testing
-
-
In Sensitivity, choose the sensitivity level. The available options are High, Medium, and Low. When the sensitivity is set to high, even minor anomalies are treated as verification failures. When the sensitivity is set to High, any anomaly, no matter how small, will be treated as a verification failure. This ensures that even the slightest issue is detected and addressed before releasing the deployment to production.
-
In Duration, choose a duration. Harness will use the data points within this duration for analysis. For instance, if you select 10 minutes, Harness will analyze the first 10 minutes of your log or APM data. It is recommended to choose 10 minutes for logging providers and 15 minutes for APM and infrastructure providers. This helps you thoroughly analyze and detect issues before releasing the deployment to production.
-
In the Artifact Tag field, reference the primary artifact that you added in the Artifacts section of the Service tab. Use the Harness expression
<+serviceConfig.artifacts.primary.tag>to reference this primary artifact. To learn about artifact expression, go to Harness expression. -
Select Fail On No Analysis if you want the pipeline to fail if there is no data from the health source. This ensures that the deployment fails when there is no data for Harness to analyze.
Create a monitored service
Harness Continuous Verification monitors the health trend deviations using logs and metrics obtained from the health source, such as APM and logging tools, via a monitored service.
To create a monitored service:
-
In the Monitored Service Name section, select Click to autocreate a monitored service.
Harness automatically generates a monitored service name by combining the service and environment names. The generated name appears in the Monitored Service Name field. Note that you cannot edit the monitored service name.
If a monitored service with the same name and environment already exists, the Click to autocreate a monitored service option is hidden and the existing monitored service is assigned to the Verify step by Harness.
If you've set up a service or environment as runtime values, the auto-create option for monitored services won't be available. When you run the pipeline, Harness combines the service and environment values to create a monitored service. If a monitored service with the same name already exists, it will be assigned to the pipeline. If not, Harness skips the Verification step.
For instance, if you input the service as todolist and the environment as dev, Harness creates a monitored service with the name todolist_dev. If a monitored service with that name exists, Harness assigns it to the pipeline. If not, Harness skips the Verification step.
Add a health source
A health source is an APM or logging tool that monitors and aggregates data in your deployment environment.
Define health source
To add a health source:
-
In the Health Sources section, select + Add New Health Source.
The Add New Health Source dialog appears.
-
On the Define Health Source tab, do the following:
-
In the Define Health Source section, select ElasticSearch as health source type.
-
In the Health Source Name field, enter a name for the health source.
-
In the Connect Health Source section, select Select Connector.
The Create or Select an Existing Connector dialog appears. -
Select a connector for the Elasticsearch health source and then select Apply Selected.
The selected connector appears in the Select Connector dropdown. -
Select Next.
The Configuration tab appears.
-
Currently, Harness supports only Elasticsearch logs. The ElasticSearch Logs option is selected by default in the Select Feature field.
Define log configuration settings
-
On the Configuration tab, select + Add Query.
The Add Query dialog appears.
-
Enter a name for the query and then select Submit.
The query that you added gets listed under the Logs Group. The Custom Queries settings are displayed. These settings help you retrieve the desired logs from the Elasticsearch platform and map them to the Harness service.
Define a query
-
In the Query Specifications and Mapping section, select a log index from the Log Indexes list.
-
In the Query field, enter a log query and select Run Query to execute it.
A sample record in the Records field. This helps you confirm the accuracy of the query you've constructed.
-
In the Field Mapping section, map the following identifiers to select the data that you want to be displayed from the logs.
- Timestamp Identifier
- Service Instance Identifier
- Message Identifier
- Timestamp Format
To define mapping, in each identifier field, do the following:
-
Select +.
The Select path for Service Instance Identifier page appears.
-
Go to the identifier value that you want to map and choose Select.
The selected value gets mapped to the corresponding identifier field.
-
Select Get sample log messages.
Sample logs are displayed that help you verify if the query you built is correct.
Query syntax
| Query type | Syntax | Description |
|---|---|---|
| Match | message:error | This query matches documents containing the term error in the message field. |
| Wildcard | message:connect* | This query matches documents where the message field contains words starting with connect. |
| Range | @timestamp:[2022-01-01 TO 2022-01-10] | This query matches documents with timestamps between January 1, 2022, and January 10, 2022. |
| Boolean | message:(error AND timeout) | This query matches documents containing both error and timeout in the message field. |
| Phrase | message:"out of memory" | This query matches documents containing the phrase out of memory in the message field. |
| Fuzzy | message:warning~ | This query matches documents containing terms similar to warning in the message field. |
| Field Existence | _exists_:status | This query matches documents where the field status exists. |
| Wildcard Field | res* | This query matches documents where the field starts with res. |
Sample queries used to find errors
| Error query type | Syntax | Description |
|---|---|---|
| Simple Error Search | message:error | Find documents where the message field contains the term error. |
| Search for Specific Error Types | message:"404 Not Found" message:"500 Internal Server Error" | Find documents where the message field contains specific error types, such as 404 Not Found or 500 Internal Server Error. |
| Search for Errors in a Specific Component | message:(error AND database) | Find documents where the message field contains the term error and another term specifying the component, for example, database. |
| Search for Critical Errors | message:(fatal OR crash OR unrecoverable) | Find documents where the message field contains terms indicating critical errors, such as fatal, crash, or unrecoverable. |
| Search for Errors with Specific Response Codes | message:(500 OR 503) | Find documents where the message field contains terms indicating errors with specific HTTP response codes, such as 500 or 503. |
| Search for Errors in a Time Range | message:error AND @timestamp:[2022-01-01 TO 2022-01-10] | Find documents with errors that occurred within a specific time range, for example, between January 1, 2022, and January 10, 2022. |
| Search for Errors with Specific Keywords | message:(exception OR failed OR "unable to") | Find documents where the message field contains specific keywords associated with errors, such as exception, failed, or unable to. |
| Search for Errors with Stack Traces | message:(at OR "caused by") | Find documents where the message field contains terms indicative of stack traces, such as at or caused by. |
Infrastructure error queries
- Search for server errors:
message:(error OR "server error" OR "internal server error") - Search for network issues:
message:(timeout OR "network error" OR "connection refused") - Search for database errors:
message:(database OR SQL OR "query error" OR "database connection") - Search for disk space issues:
message:(disk OR "disk space" OR "disk error" OR "disk full") - Search for infrastructure configuration errors:
message:(configuration OR "config error" OR "invalid configuration") - Search for hardware failures:
message:(hardware OR "hardware error" OR "device failure") - Search for service unavailability:
message:(unavailable OR "service down" OR "service unavailable") - Search for performance issues:
message:(performance OR "slow response" OR "high latency")
API error queries
- Search for HTTP status codes indicating errors:
message:(404 OR 500 OR 503 OR 403) - Search for API response error messages:
message:(error OR failed OR "unable to") - Search for specific API error codes:
message:(API_ERROR_CODE1 OR API_ERROR_CODE2) - Search for timeout errors:
message:(timeout OR "connection timed out" OR "request timeout") - Search for rate limit exceeded errors:
message:(rate OR "rate limit" OR "rate exceeded") - Search for authentication errors:
message:(unauthorized OR "authentication failed") - Search for API input validation errors:
message:(invalid OR "validation error") - Search for API gateway errors:
message:(gateway OR "proxy error" OR "gateway error")
Performance error queries
- Search for slow requests:
message:(slow OR "slow response" OR "long duration") - Search for high latency:
message:(latency OR "high latency" OR "latency exceeded threshold") - Search for memory leaks:
message:(memory OR "out of memory" OR "memory exhausted") - Search for CPU usage errors:
message:(cpu OR "high CPU usage" OR "CPU overload") - Search for disk I/O issues:
message:(disk OR "disk I/O error" OR "slow disk I/O") - Search for database query performance issues:
message:(database OR "slow query" OR "database bottleneck") - Search for network latency:
message:(network OR "network latency" OR "network bottleneck") - Search for resource starvation:
message:(resource OR "resource starvation" OR "resource exhaustion")
Save the health source settings
-
After configuring all the settings, select Submit to add the health source to the Verify step.
-
Select Apply Changes to save the changes made to the Verify step.
Run the pipeline
To run the pipeline:
-
In the upper-right corner, select Run.
The Run Pipeline dialog box appears.
-
In the dialog box, do the following:
- Tag: If you did not add a tag in the** Artifact Details** settings, select it now.
- Skip preflight check: Select this option if you want to skip the preflight check.
- Notify only me about execution status: Select this option if you want Harness to alert only you about the execution status.
-
Select Run Pipeline.
The pipeline starts running.
View results
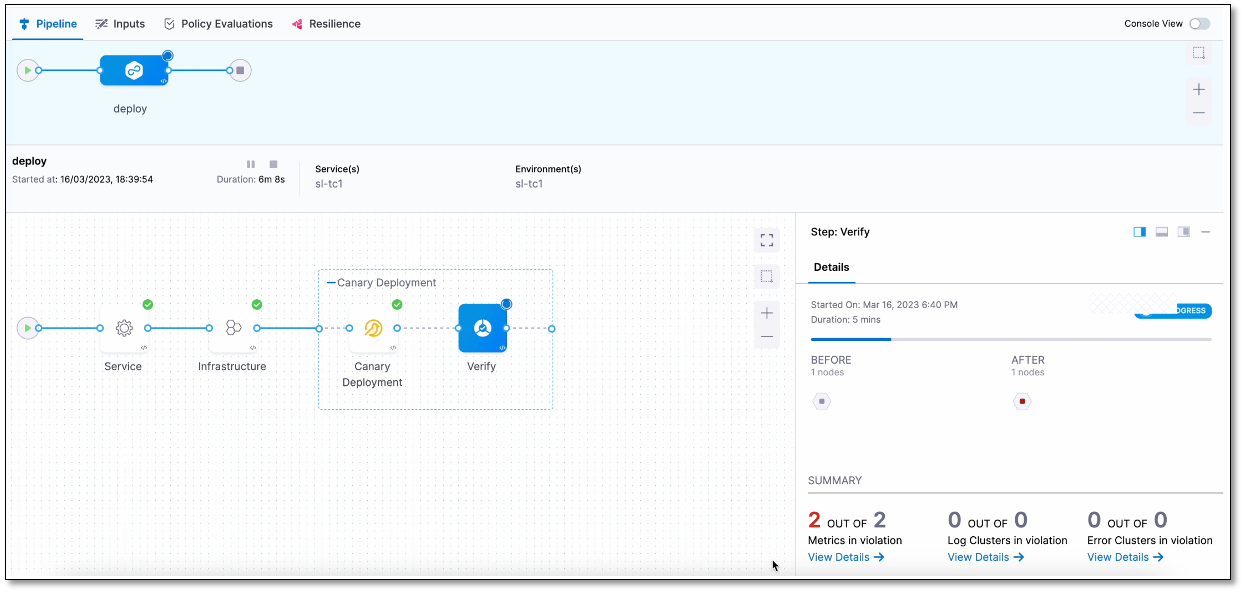
The Summary section displays the following details when the Verify step begins:
- Metrics in violation
- Log Clusters in violation
- Error Clusters in violation
Note that it may take some time for the analysis to begin. The screenshot below shows a Verification step running in a deployment:
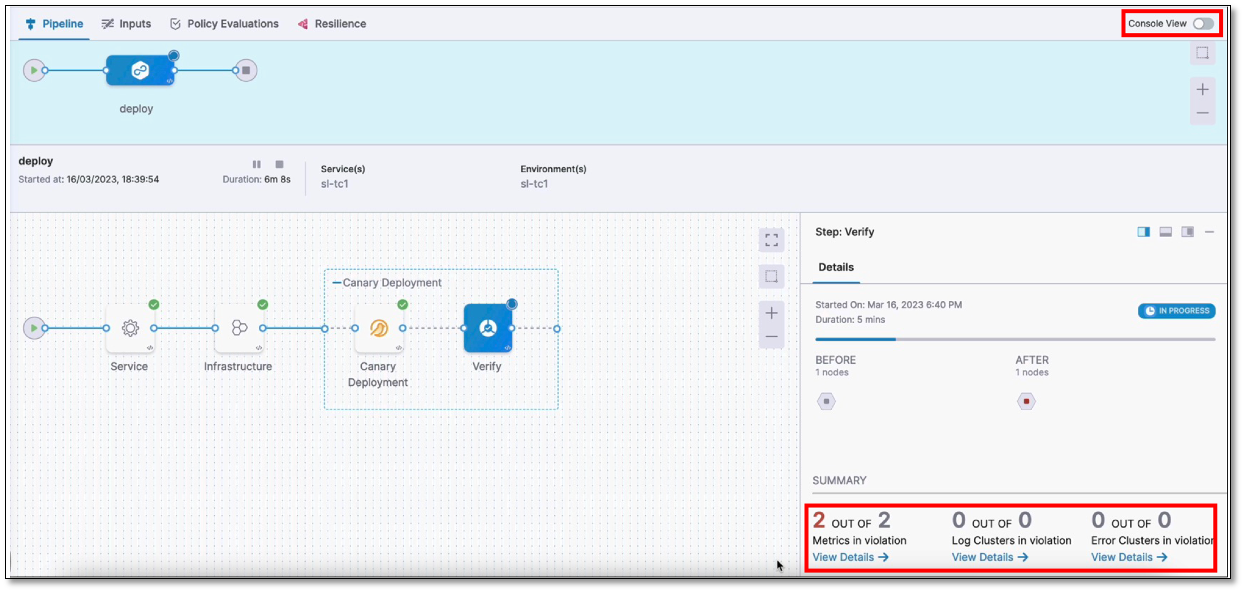
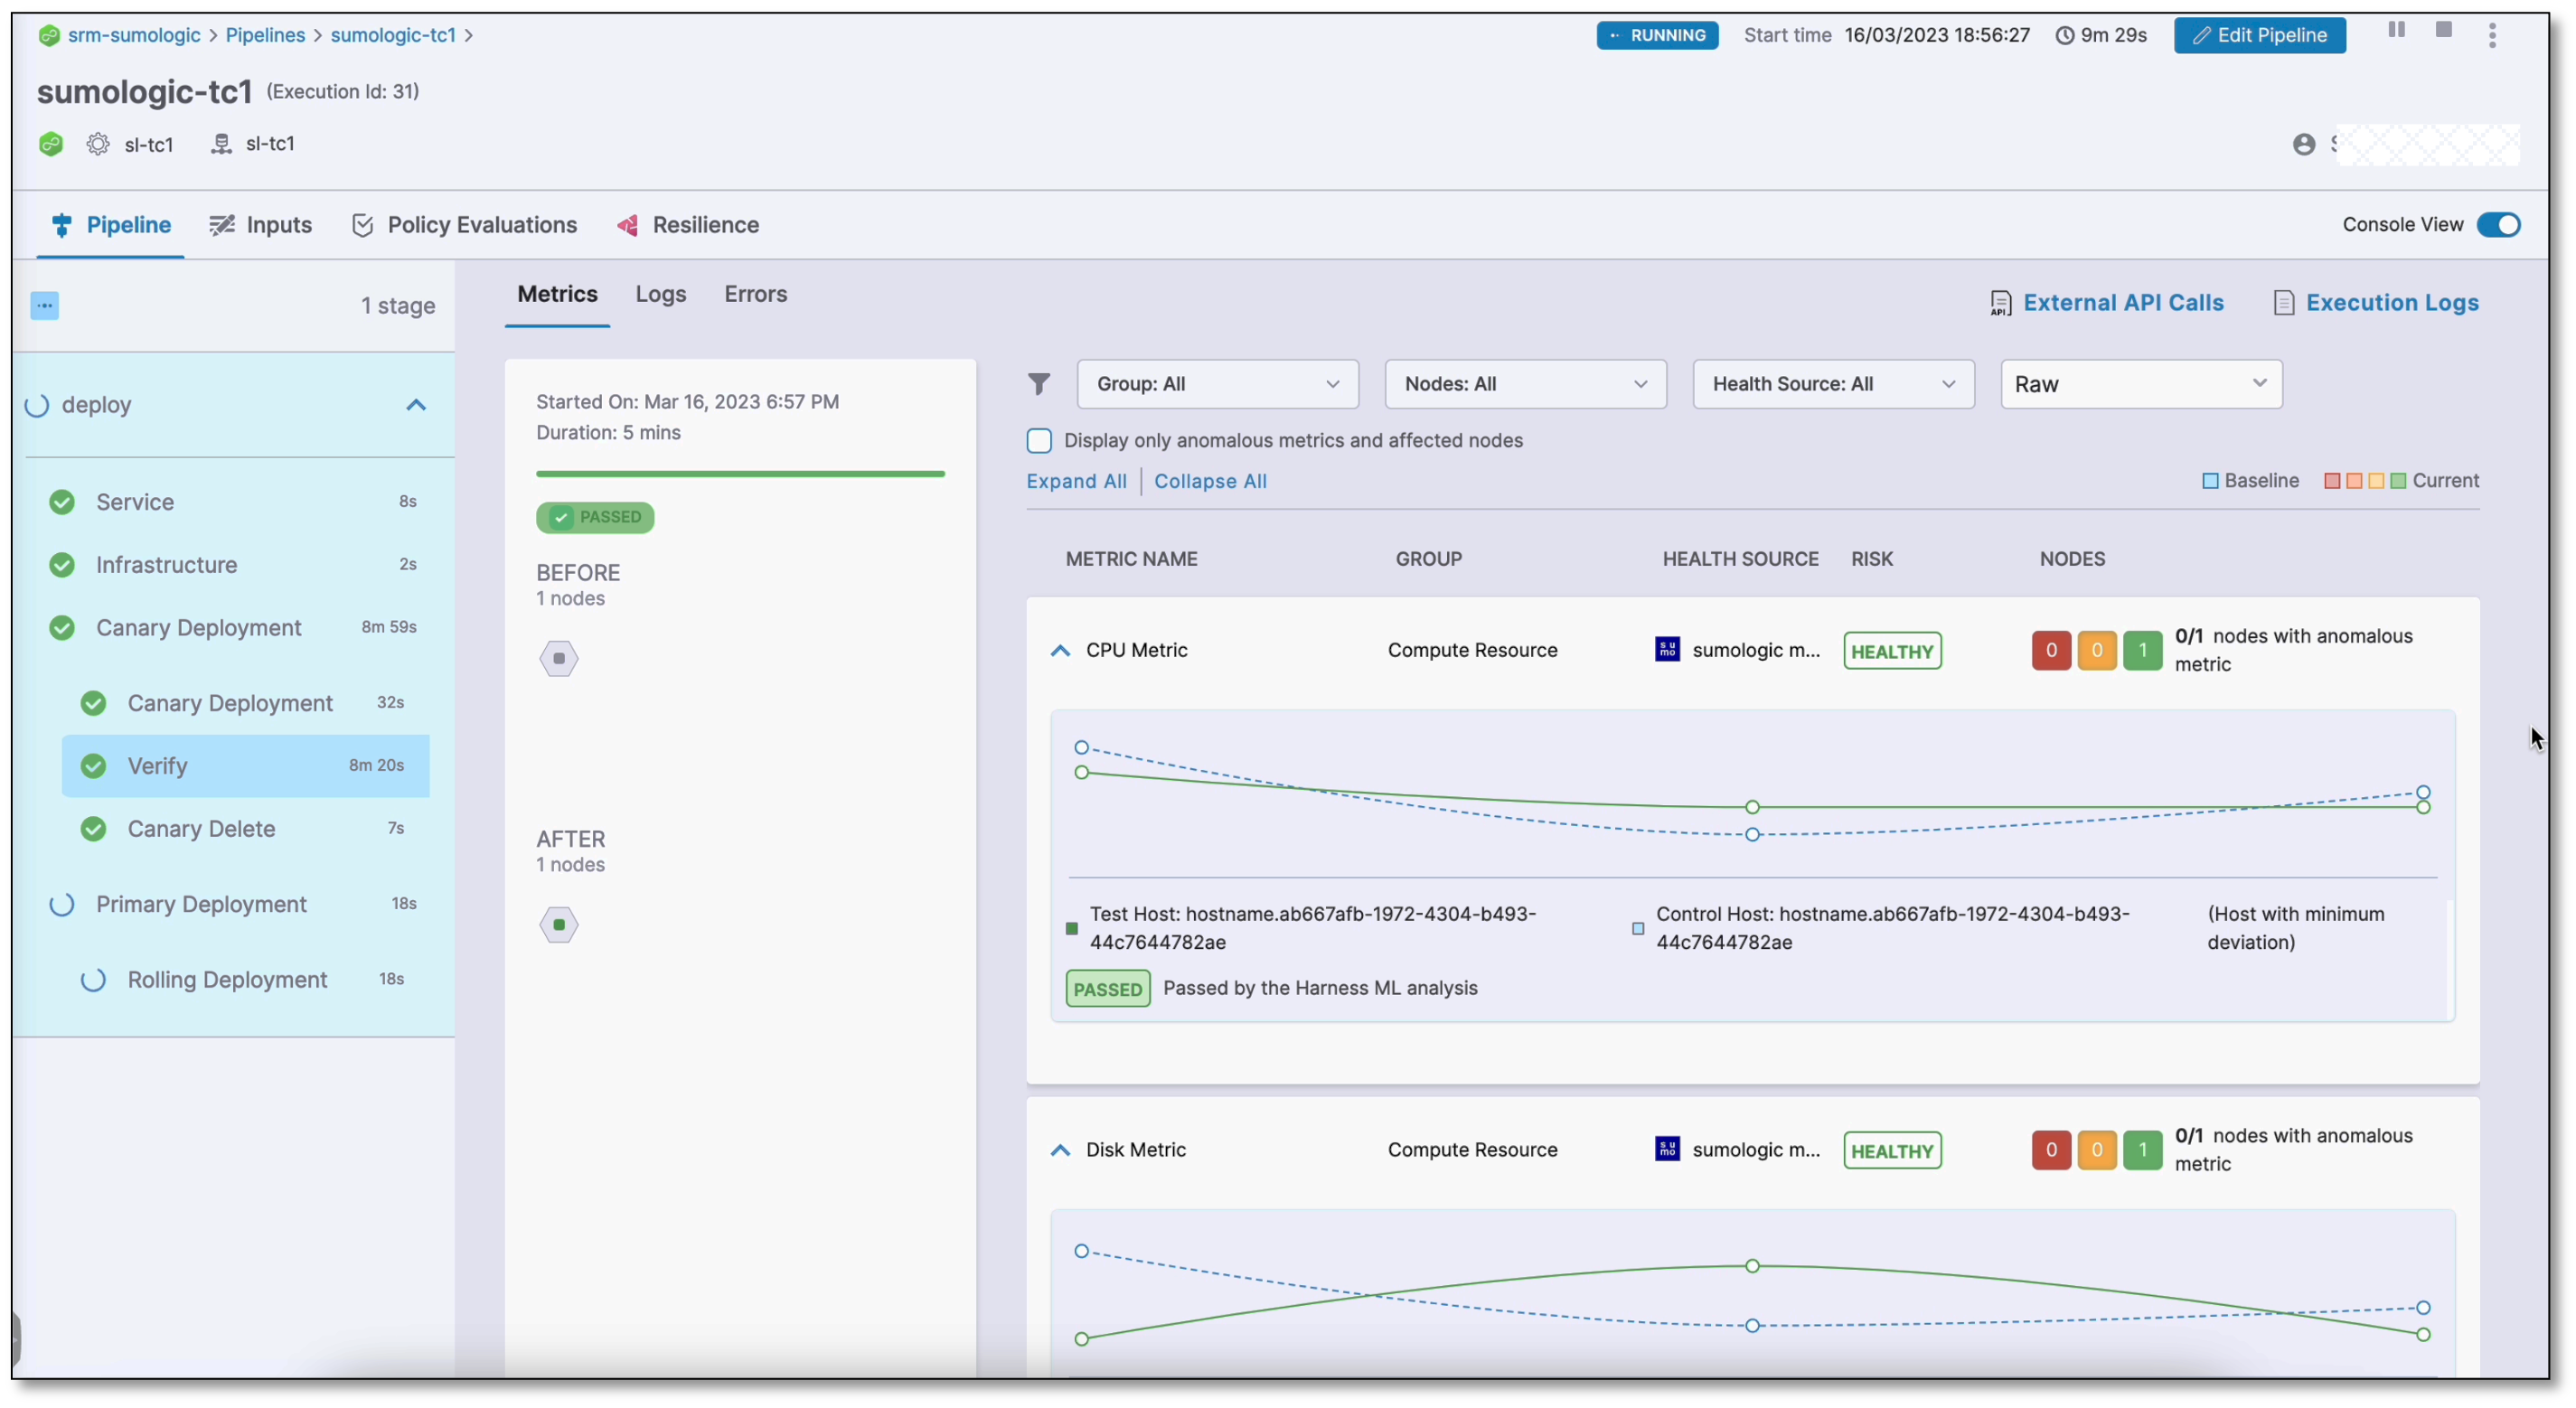
Console view
The console view displays detailed logs of the pipeline, including verification logs. To view the console, select View Details in the Summary section or turn on the Console View toggle switch in the upper-right corner.
By default, the console displays logs of only the anomalous metrics and affected nodes. To see all logs, clear the Display only anomalous metrics and affected nodes check box.
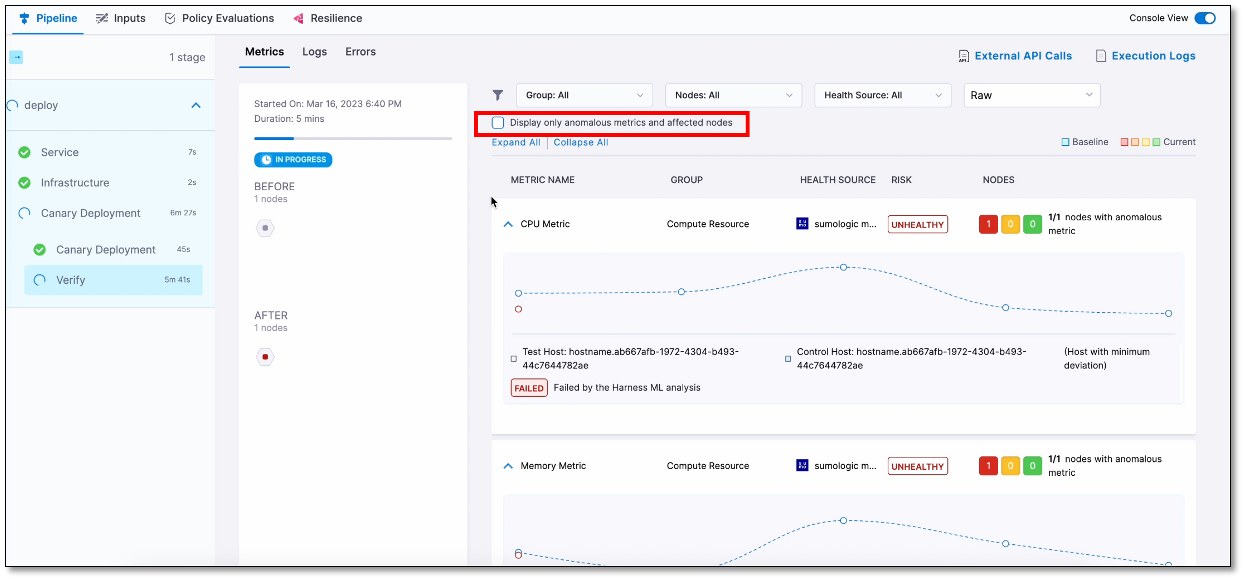
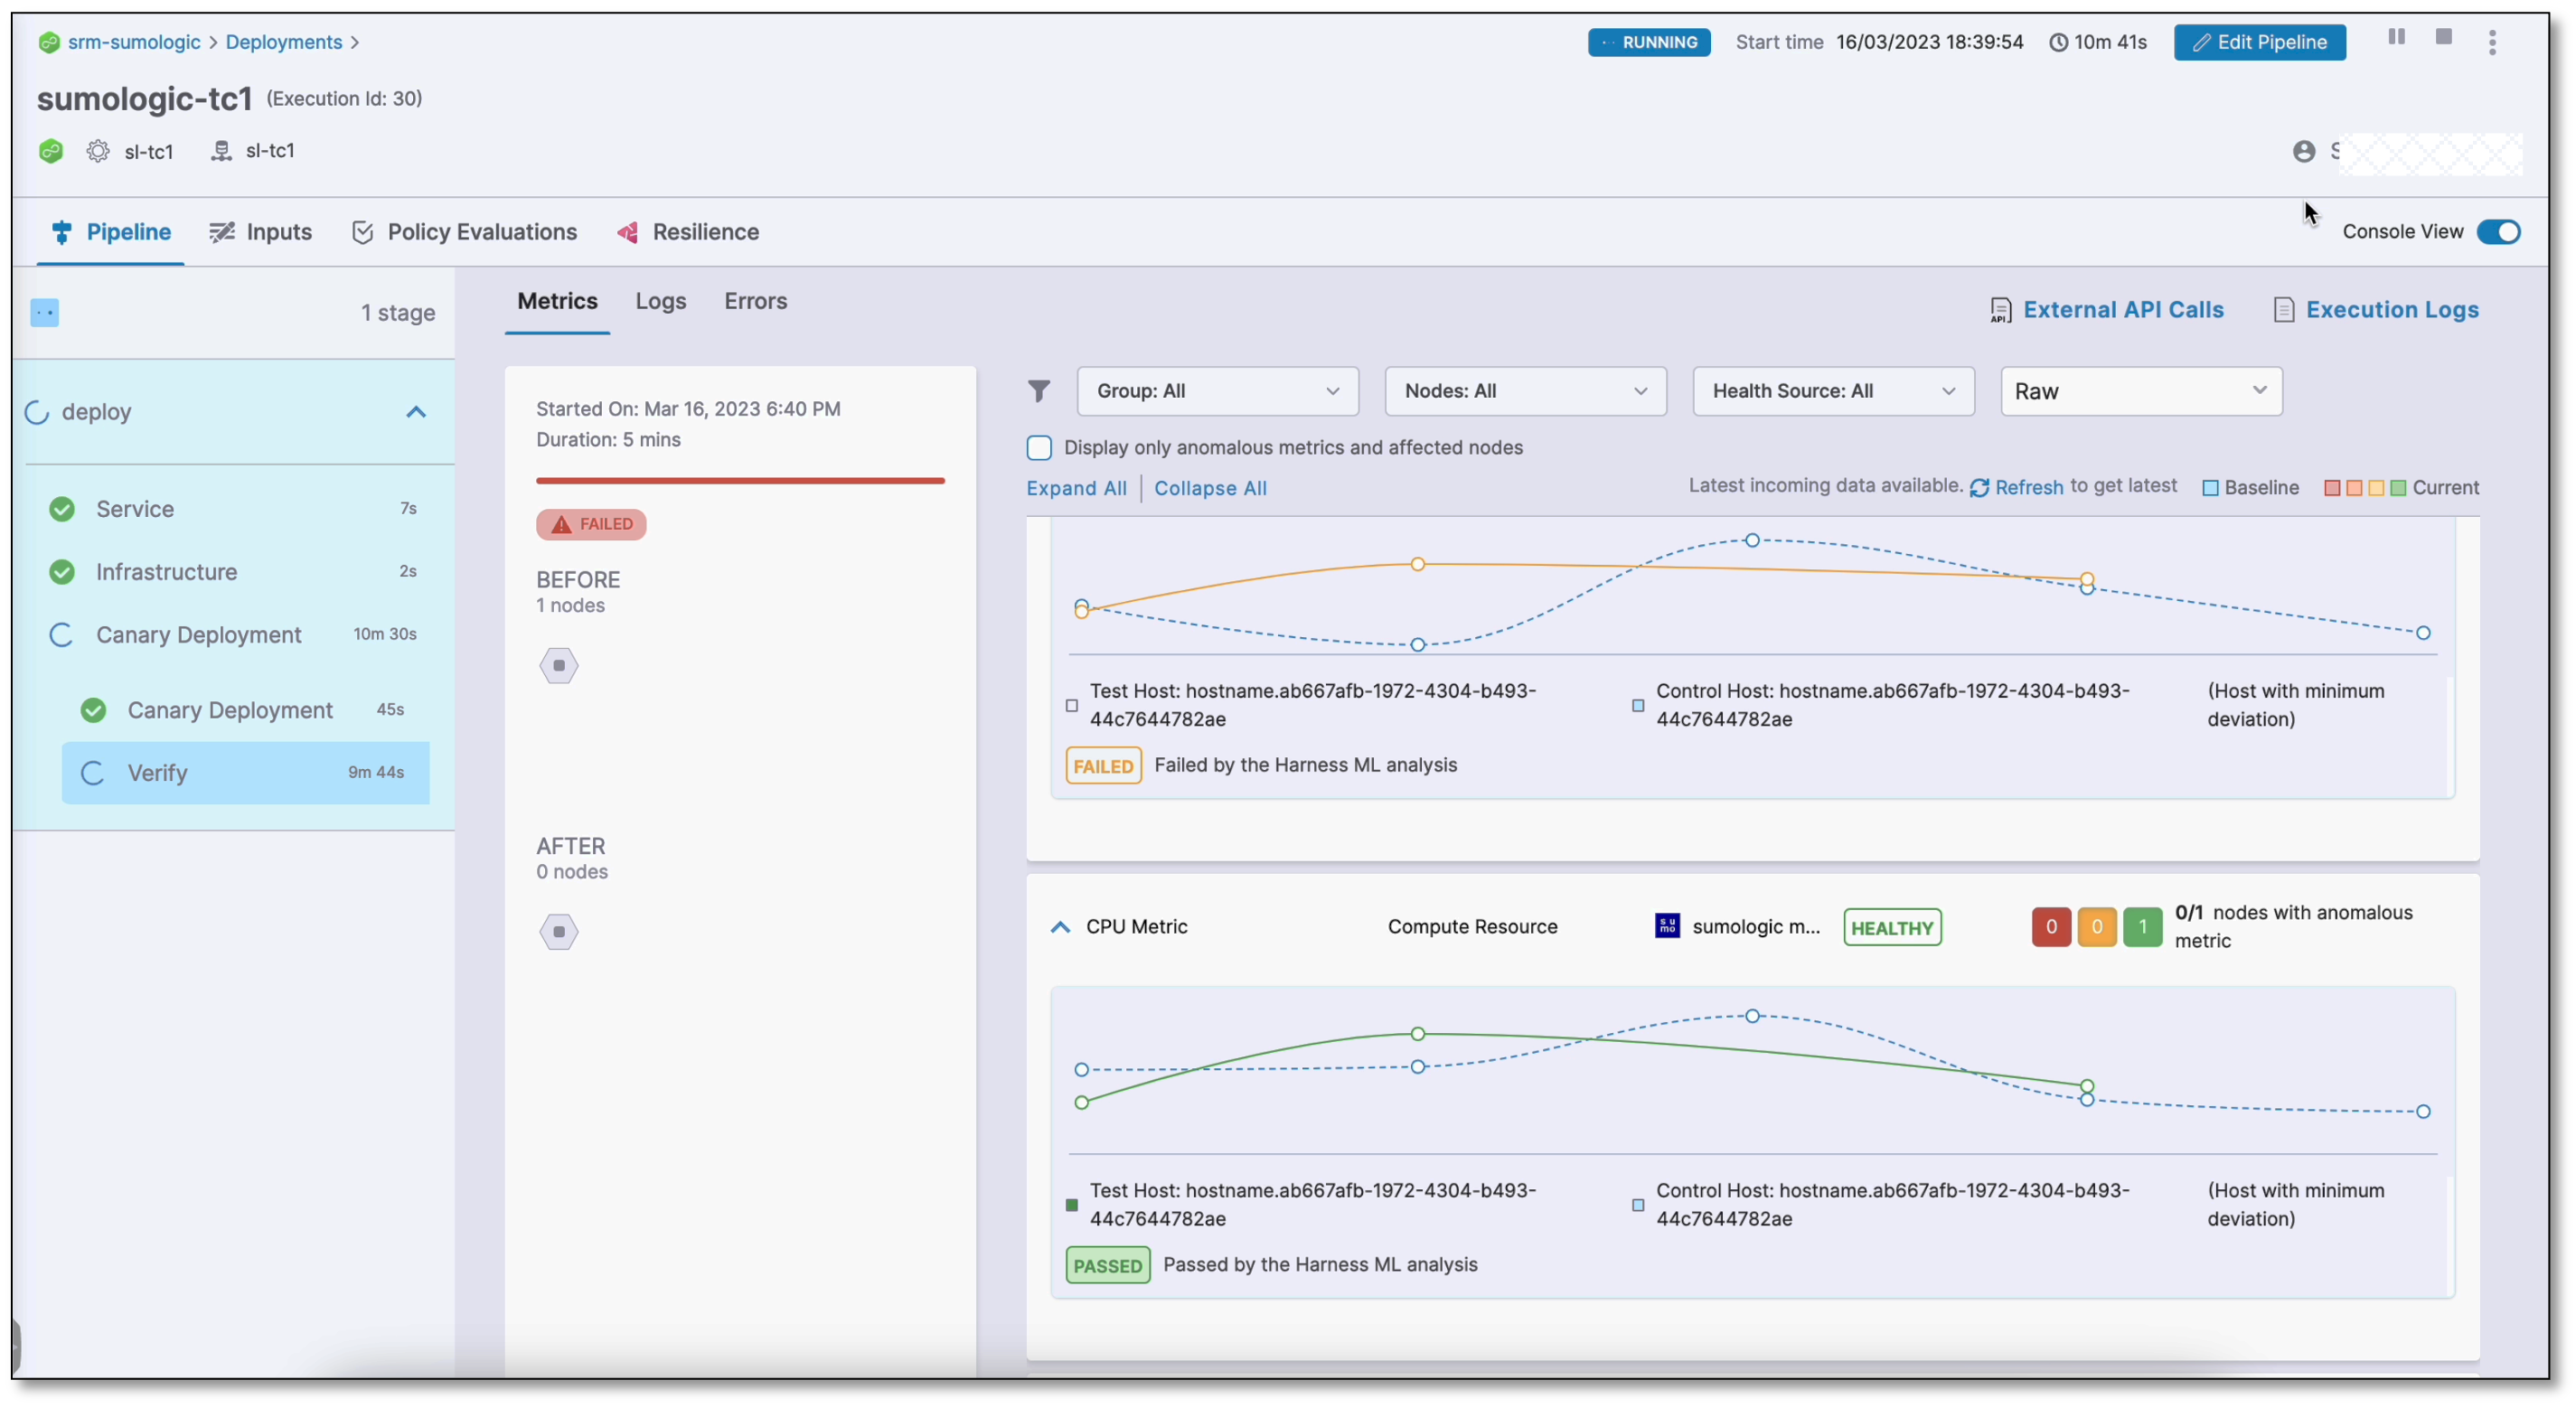
The following screenshots show successful and failed verifications in a deployment run:
Successful verification
Failed verification
Set a pinned baseline
Currently, this feature is behind the feature flag SRM_ENABLE_BASELINE_BASED_VERIFICATION. Contact Harness Support to enable the feature.
You can set specific verification in a successful pipeline execution as a baseline. This is available with Load Testing as the verification type.
Set successful verification as a baseline
To set a verification as baseline for future verifications:
-
In Harness, go to Deployments, select Pipelines, and find the pipeline you want to use as the baseline.
-
Select the successful pipeline execution with the verification that you want to use as the baseline.
The pipeline execution is displayed.
-
On the pipeline execution, navigate to the Verify section, and then select Pin baseline.
The selected verification is now set as the baseline for future verifications.
Replace an existing pinned baseline
To use a new baseline from a pipeline and replace the existing pinned baseline, follow these steps:
-
In Harness, go to Deployments, select Pipelines, and find the pipeline from which you want to remove the baseline.
-
Select the successful pipeline execution with the verification that you have previously pinned as the baseline.
-
On the pipeline execution, navigate to the Verify section, and then select Pin baseline.
A confirmation alert message appears, asking if you want to replace the existing pinned baseline with the current verification. After you confirm, the existing pinned baseline gets replaced with the current verification.