Interpret Log Verification Results
Logs emitted by a service provide valuable insights into its operations. Developers typically use logs for the following purposes:
-
Support custom metrics: Contains information that can be used to aggregate custom metrics.
-
Debugging: Helps developers diagnose and troubleshoot issues reported in the service.
During the debugging process, developers often perform the following tasks:
-
Check for new errors: Examine if any new errors have been reported by the service.
-
Monitor error frequency: Observe whether the occurrence frequency of any errors has changed.
Doing these tasks manually can be cumbersome. Developers usually start by filtering errors one by one until they come across new ones. They might use wildcard-based filters to exclude similar errors. However, there is no fixed pattern for these filters, as they vary depending on the specific errors.
Now, let's consider the context of an issue reported after a recent deployment. Developers manually analyze the logs to identify new errors and changes in error frequency compared to the previous version of the service.
This is where log analysis with Harness Continuous Verification (CV) comes into play for developers. It offers the following benefits:
-
Log analysis helps automatically identify new errors and changes in error frequency after deployment before they become widespread issues.
-
Debugging the issue.
Logging tools such as Google Cloud Operations and Splunk help you capture and analyze logs for various purposes, such as debugging, monitoring, auditing, and security. To see the list of logging tools supported by Harness, go to What's supported in CV.
Log verification in Harness CV
You can configure your logging tool (also known as a health source) in Harness CV. Harness CV uses the logs provided by your logging tool to analyze errors. Harness CV log analysis employs a clustering mechanism to group similar errors together and compares them with error clusters from previous service versions. Harness CV uses Machine Learning (ML) in the clustering and comparison process because it cannot be accomplished using fixed user-defined rules alone. For more information on how Harness CV uses ML, go to Machine Learning Usage in Continuous Verification.
Harness CV classifies the error clusters identified by the ML model during log analysis into the following categories:
-
Known: Errors that were also present in the previous version.
-
Unknown: New errors that have not been observed before.
-
Unexpected Frequency: Errors with an increased occurrence frequency.
View log verification results
Harness CV provides a powerful mechanism to visualize and interpret the log verification results.
Prerequisite: You should have added a health source to the Verify step and run the pipeline. To learn more about how to add a health source to the verify step and run the pipeline, go to Configure verification.
To view log verification results for a pipeline:
-
In your Harness project, navigate to the Deployments module > Pipelines, and then select a pipeline for which you want to view the verification results.
-
In the top right corner, select Execution History, and from the pipeline executions list, choose the execution for which you want to see the verification results.
-
Ensure that the Console View toggle switch is turned on.
-
From the stages list, expand the stage in which you want to see the verification results, and then select Verify.
Verification details appear on the right. -
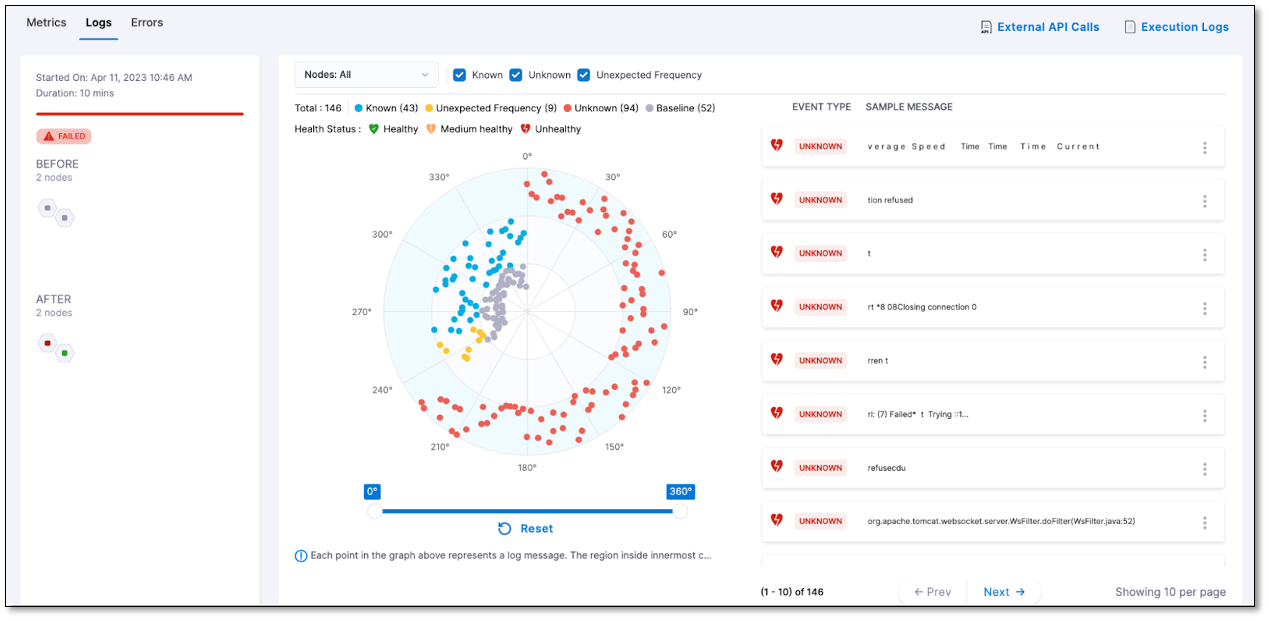
Go to the Logs tab to see the log verification details.
The Logs tab displays the following details:
-
A Radar Chart
-
Event list

Radar Chart
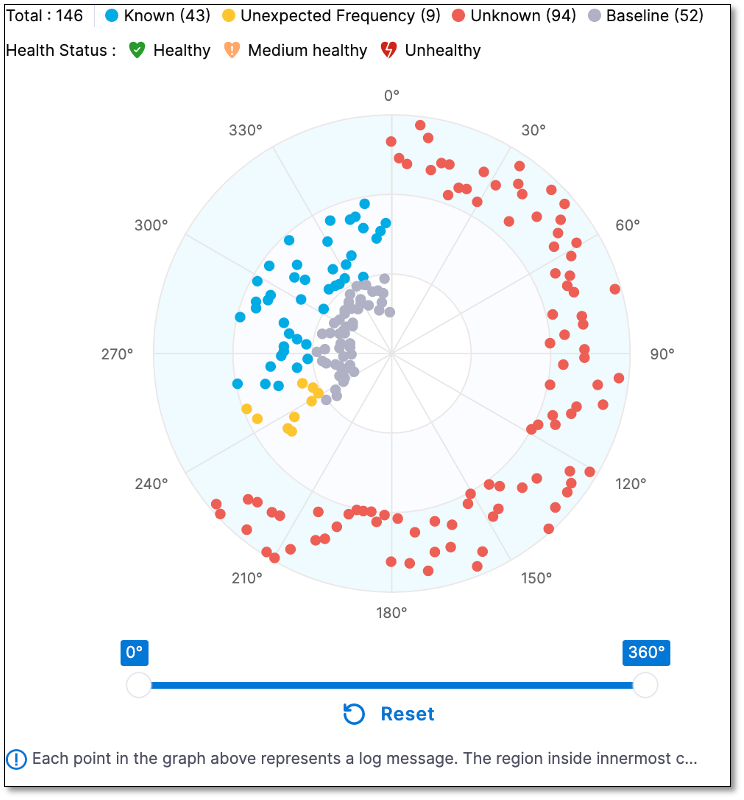
The Radar chart presents a comprehensive bird's-eye view of all the log clusters detected during log verification. This visual representation allows you to quickly understand the distribution and magnitude of each type of cluster.

The radar chart visually organizes log clusters into three concentric circles. The outermost circle represents all the Unknown event clusters, while the middle circle contains both Known and Unexpected Frequency clusters.
Each point on the Radar Chart represents a log message. The region inside the innermost circle represents logs from baseline or control nodes. The region between the outermost circle and the second circle represents Unknown events clusters. The region between the second circle and the innermost circle represents Unexpected frequency clusters observed in Canary nodes. The clusters that are related (logs observed in both Canary and baseline nodes) are shown on the same radii. The Radar Graph is divided into several sectors, with each sector having several log messages.
You can view the following on the Radar Chart:
-
Sample message: Hover over a cluster to view a sample message associated with that cluster. When you hover over Known and Unexpected frequency clusters, the innermost circle highlights the cluster seen on the Primary or Before nodes.
-
Cluster details: Select a cluster to view the Event Details page. The Event Details page displays the event health, type, and total number of events in the cluster.
-
View specific clusters in a specific cluster: A slider located below the chart enables users to zoom in on a specific set of log clusters, allowing for a closer examination and analysis. The Radar Graph is divided into several sectors, with each sector having several log messages. Use the slider to view the log clusters in a specific sector. When you select a sector using the slider, the event list displays the events specific to that sector.
At the top of the radar chart, the count of each cluster type is displayed.
Event list
The Event list provides a comprehensive listing of the clusters shown in the Radar Chart. It includes information such as event health, type, and a sample message. When you use the slider to select a specific sector on the Radar Graph, the Events List dynamically updates to show only the clusters that belong to that particular sector, allowing you to focus on specific sets of data.
Event type
The event type refers to a cluster of similar logs. During log verification, log clusters found on Canary or After nodes are classified into three categories:
-
Known: Log clusters that were seen on at least one of the Primary or Before nodes.
-
Unknown: New log clusters observed only on the Canary or After nodes.
-
Unexpected frequency: Log clusters that were seen on both Canary or After nodes and Primary or Before nodes, but with increased frequency.
Baseline clusters encompass all the log clusters seen on the Primary or Before nodes. All the Known and Unexpected frequency clusters match one of the Baseline clusters.
Ensure that you have configured queries as part of the health source configuration. These queries are designed to filter error logs emitted by the service. Detecting any Unknown and Unexpected frequency log clusters can serve as valuable indications of potential issues in the deployment.
Event health
Event health has three possible values: Healthy, Medium Healthy, and Unhealthy. These values are directly associated with the Known, Unexpected frequency, and Unknown event types, respectively, if you have not set any event preferences. However, you have the ability to modify this mapping by setting preferences for a log cluster. For example, marking an "unknown" cluster as non-risky would change its classification to "Healthy." For more information on the event preference setting feature, go to Event preference or log feedback.
Sensitivity and event health
The event health plays a crucial role in the verification process and is determined based on the sensitivity configuration of the verify step. The rules for determining verification outcomes are as follows:
-
High sensitivity: Verification fails if there is any Unhealthy or Medium Healthy cluster that is not set by the user. If a user sets an event preference to medium risk that will set the cluster to medium healthy, but will not fail for high sensitivity verification.
-
Medium sensitivity: Verification fails if there is any Unhealthy cluster.
-
Low sensitivity: Verification fails if there is any Unhealthy cluster.
Event Details page
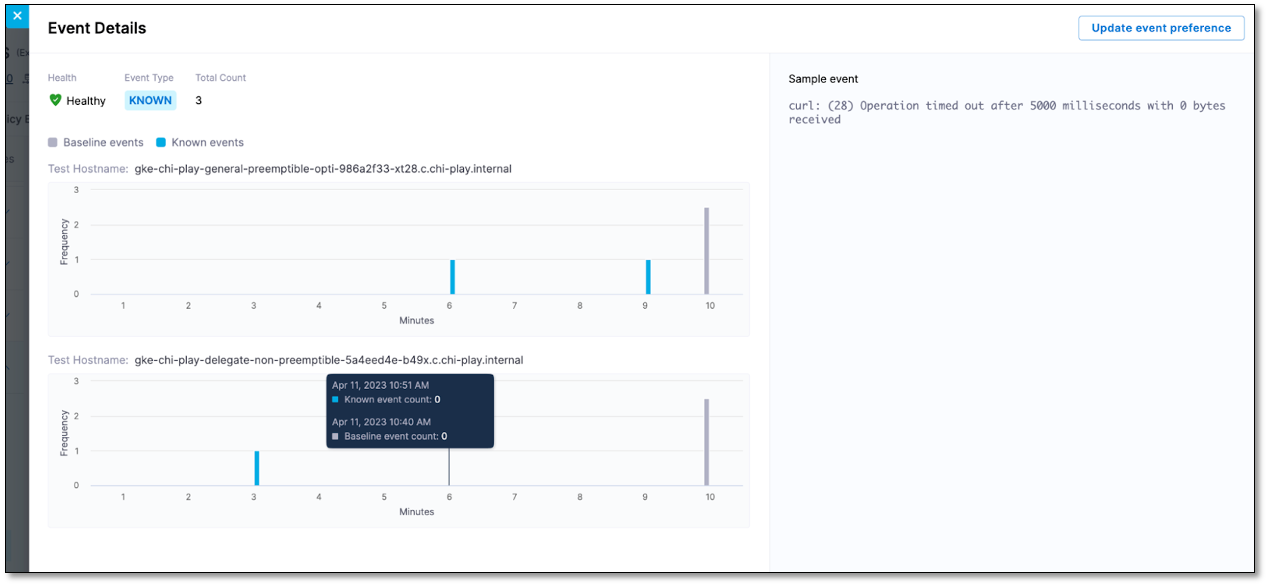
The Event Details page provides details such as the event health, type, and total number of events in the cluster.
You can go to the Event Details page of a cluster in the following ways:
-
Clicking on a cluster on the Radar Chart.
-
Clicking on a cluster on the Event list.

The Event Details page displays the following information:
-
Total count: Represents the overall number of times the log cluster occurred across the Canary or After nodes.
-
Cluster occurrence graph: For each Canary or After node where this log cluster is found, a graph is displayed. The graph shows the occurrence of the log cluster on each node, along with the corresponding time stamps.
-
In the example below, the log cluster was seen on two nodes, so two graphs are shown. The verification process ran for 10 minutes, resulting in 10 points on each graph, representing each minute. You can view the timestamp and occurrence count for each minute on the graph.
-
Baseline cluster occurrence count: The occurrence count of the baseline cluster for Known and Unexpected frequency clusters is also displayed. The baseline cluster count is calculated by summing up its occurrences across all Primary or Before nodes.
On the Event Details page, you can also see the sample event for the event cluster.
Next steps
Enhance the accuracy of the log verification process using log feedback.