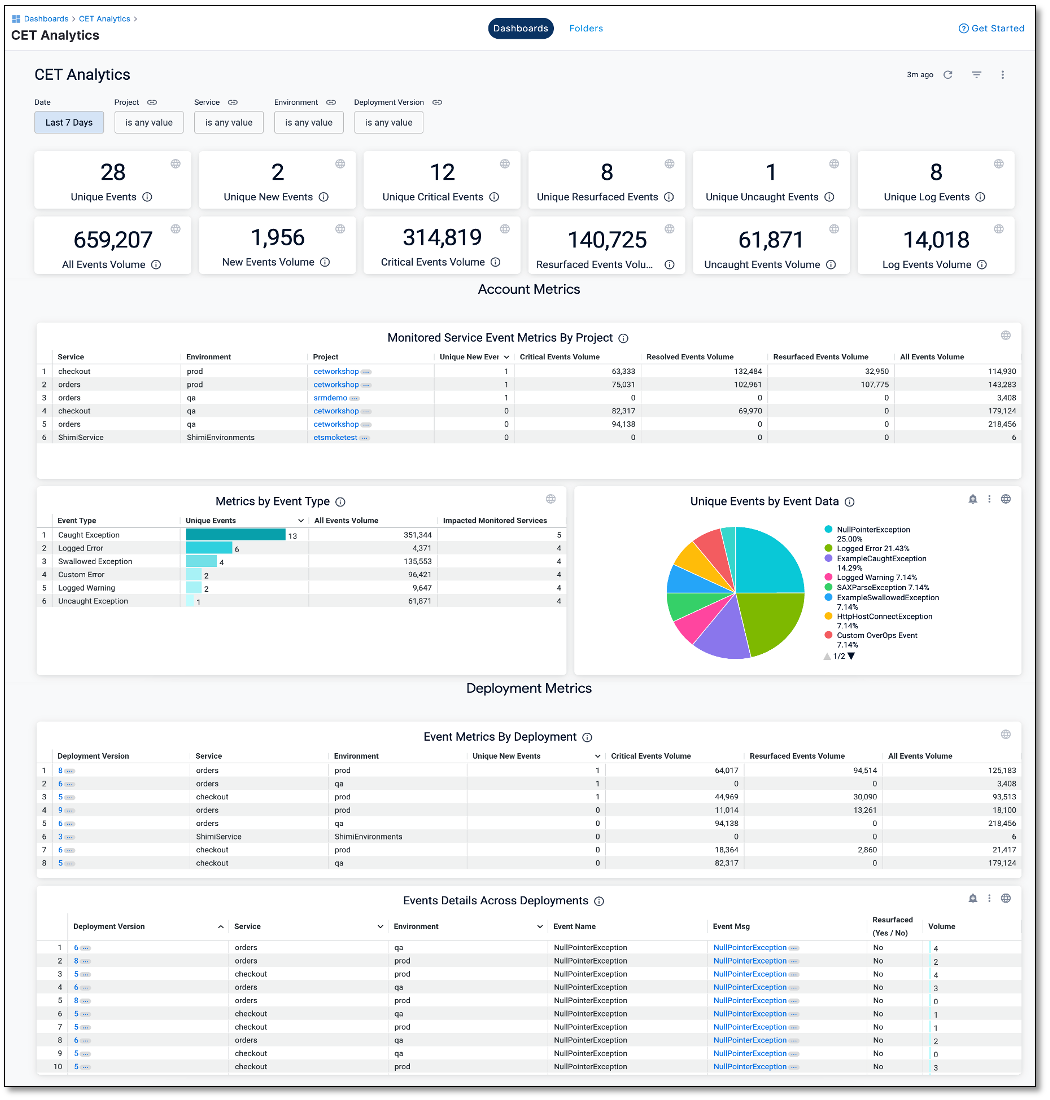
CET Analytics dashboard
The CET Analytics is the default dashboard that you see when accessing the CET Dashboard page for the first time. It provides comprehensive insights into all the error tracking events within your Harness organization.
View CET Analytics dashboard
To access the CET Analytics dashboard, do the following:
-
Within your Harness project, navigate to Dashboards. On the Dashboards page, select Error Tracking.
The dashboard list is displayed, which includes the default CET Analytics dashboard.
-
Select the CET Analytics dashboard.
The CET Analytics dashboard is displayed.

Explore CET Analytics dashboard
The CET Analytics dashboard provides comprehensive insights into event data across deployments and projects. The dashboard offers several key features to help you with effective error tracking and analysis:
Filter Options
You can filter event data on the dashboard by specific criteria, including time intervals (days), projects, monitored services, environments, and deployment versions. This helps you focus on the data most relevant for analysis.
Events overview
The dashboard provides an overview of events across projects and monitored services. It includes the following information:
-
Unique Events: Displays the total number of unique events.
-
Unique New Events: Highlights events that are new and have not occurred previously.
-
Unique Critical Events: Shows the count of unique events categorized as critical.
-
Unique Resurfaced Events: Indicates events that have reappeared after being resolved.
-
Unique Uncaught Events: Highlights events that were not caught or handled.
-
Unique Log Events: Represents events classified as logs.
-
All Events Volume: Provides a comprehensive count of all events.
-
New Events Volume: Indicates the volume of newly occurring events.
-
Critical Events Volume: Displays the count of events categorized as critical.
-
Resurfaced Events Volume: Highlights the volume of events that have resurfaced.
-
Uncaught Events Volume: Shows the count of unhandled events.
-
Log Events Volume: Represents the number of events classified as logs.
Account Metrics section
The Account Metrics section displays the following insights related to event metrics across projects:
Monitored Service Event Metrics by Project tile
Displays a detailed breakdown of event metrics by project. Each row corresponds to a monitored service, providing event counts for individual monitored services within a project. Metrics include service name, environment, project, unique new events, critical event volume, resolved events volume, resurfaced events volume, and all events volume. Clicking on a project navigates to the events summary page for further analysis.
Metrics by Event Type tile
Provides an overview of event types, including logged errors, swallowed exceptions, custom errors, logged warnings, and uncaught exceptions. Displays unique event counts using a bar graph, total event volume, and the number of impacted monitored services.
Unique Events by Data chart
A visual representation of unique events is presented through an easy-to-read pie chart.
Deployment Metrics section
The Deployment Metrics section displays insights related to event metrics and details across deployments:
Event Metrics By Deployment tile
Displays insights into deployment versions with the highest event volumes. Each row represents a deployment version and provides information on monitored service names, environment names, unique new events, critical events volume, resurfaced events volume, and all events volume.
Event Details Across Deployments tile
Provides data that helps you compare specific events across different services or deployment versions. Each row represents an individual event, offering details such as deployment version, service, environment, event name, event message, resurfacing status, and event volume.