Configure Prometheus as health source
In Harness, a health source is a mapping that connects a Service in Harness to a service running in a deployment environment that is being monitored by an Application Performance Monitoring (APM) or logging tool. This mapping allows Harness to collect metrics and data from the APM or logging tool and use it to determine the health and status of the Service in Harness.
This topic describes how to set up Prometheus as a health source in a monitored service.
-
Prometheus queries must include filters (enclosed in curly braces) to specify the nodes or data points you want to sample.
-
Prometheus queries must produce a single value (scalar). To learn more about Prometheus queries, go to QUERYING PROMETHEUS.
-
The Prometheus connector and health source provided by Harness are compatible with Mimir, Cortex, Thanos, Coralogix, and VictoriaMetrics platforms.
Prerequisites
- Prometheus connector has been added to the Harness platform.
- A monitored service has already been created in the Harness SRM.
Add Prometheus health source
To add Prometheus as a health source:
-
In your Harness project, go to Service Reliability > Monitored Services.
A list of monitored services is displayed. -
Locate the monitored service for which you want to add a custom change source, select the three vertical dots next to it, and then select Edit service.
The Configurations page appears. -
Go to the Service tab, and under Define Your Sources, select + Add New Health Source.
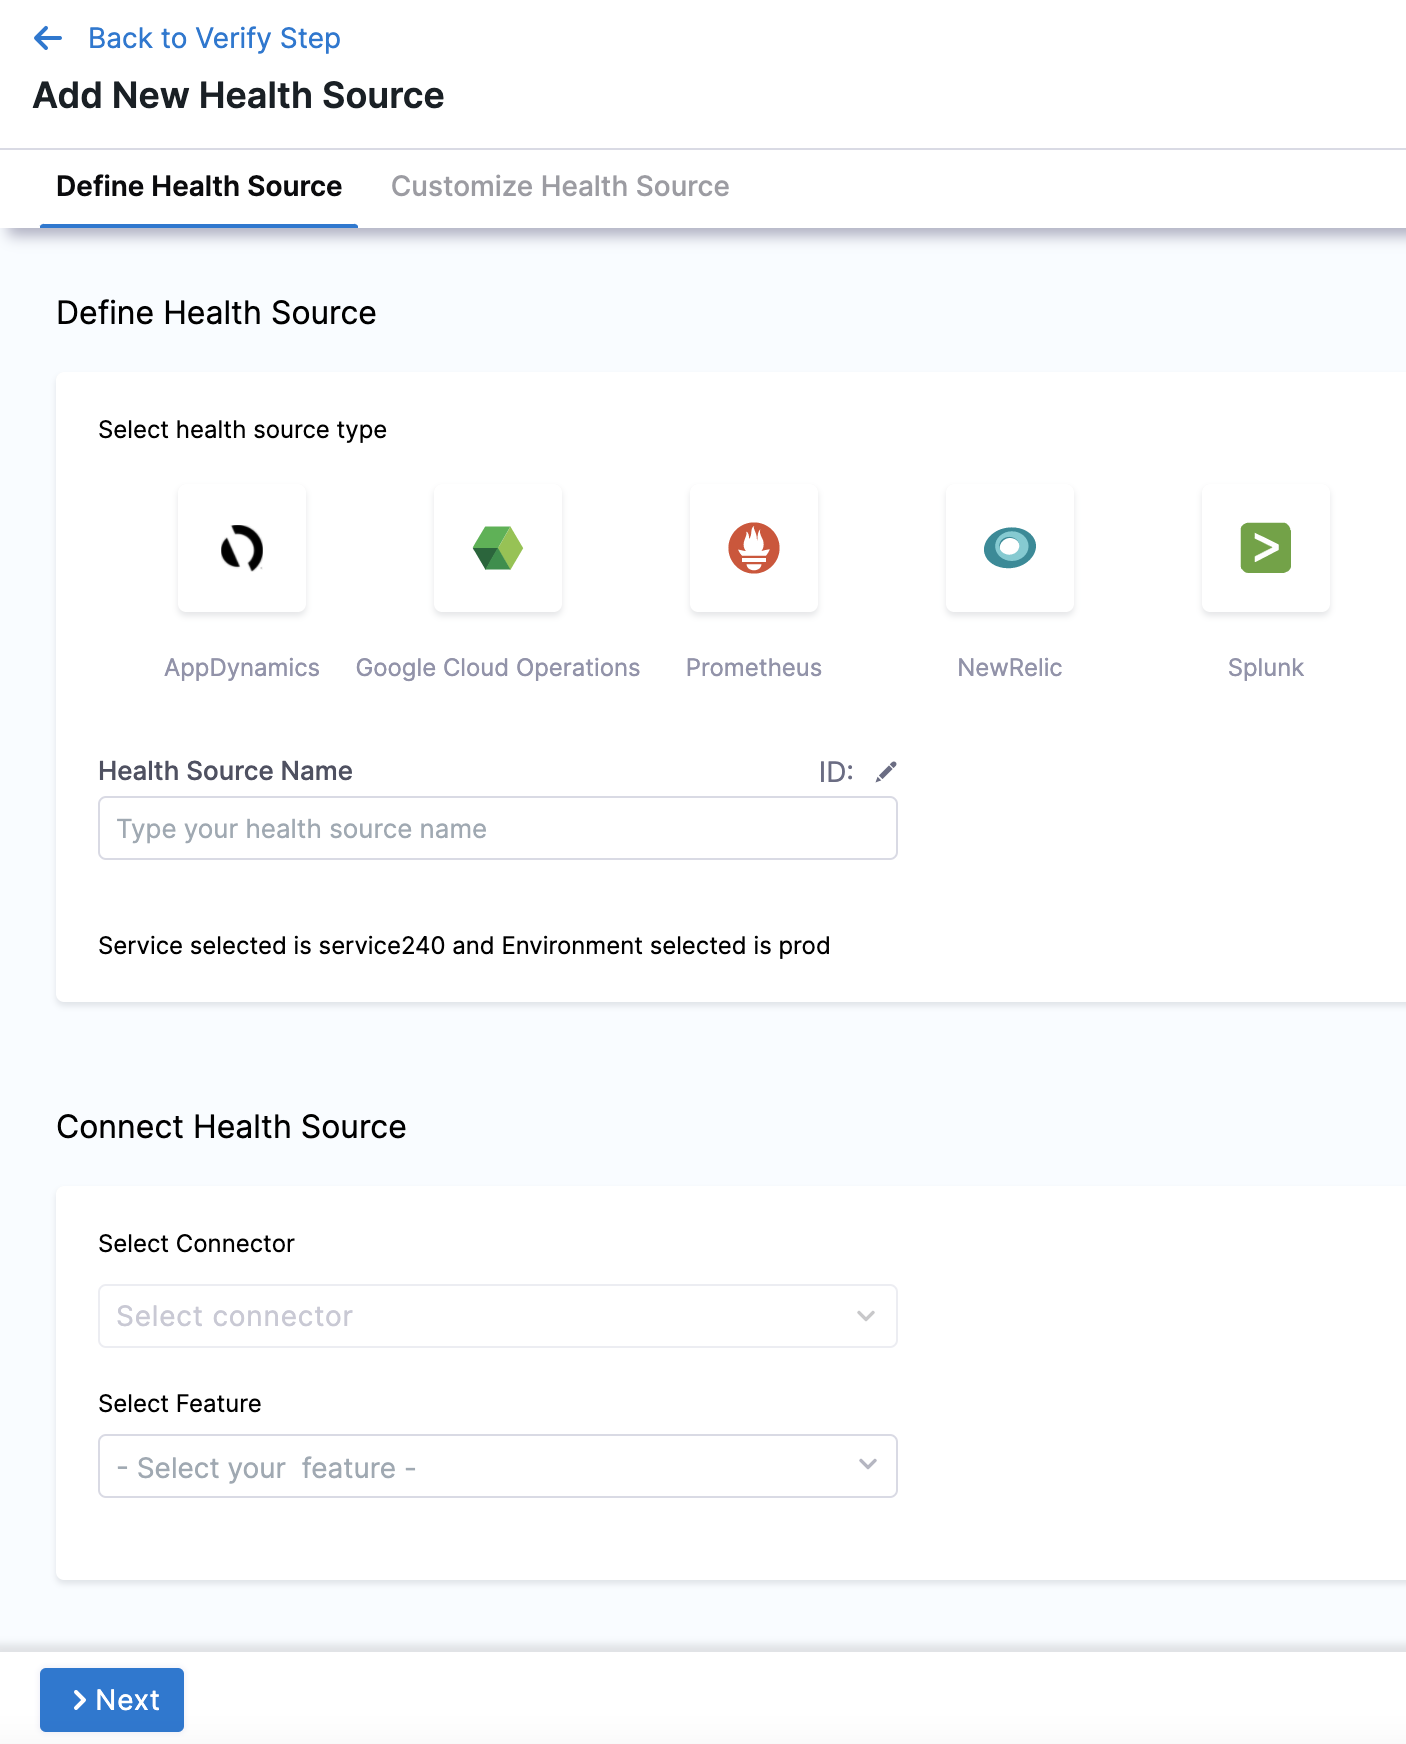
- In Select health source type, select Prometheus.
- In Health Source Name, enter a name for the Health Source.
- Under Connect Health Source, click Select Connector.
- In Connector settings, you can either choose an existing connector or click New Connector.
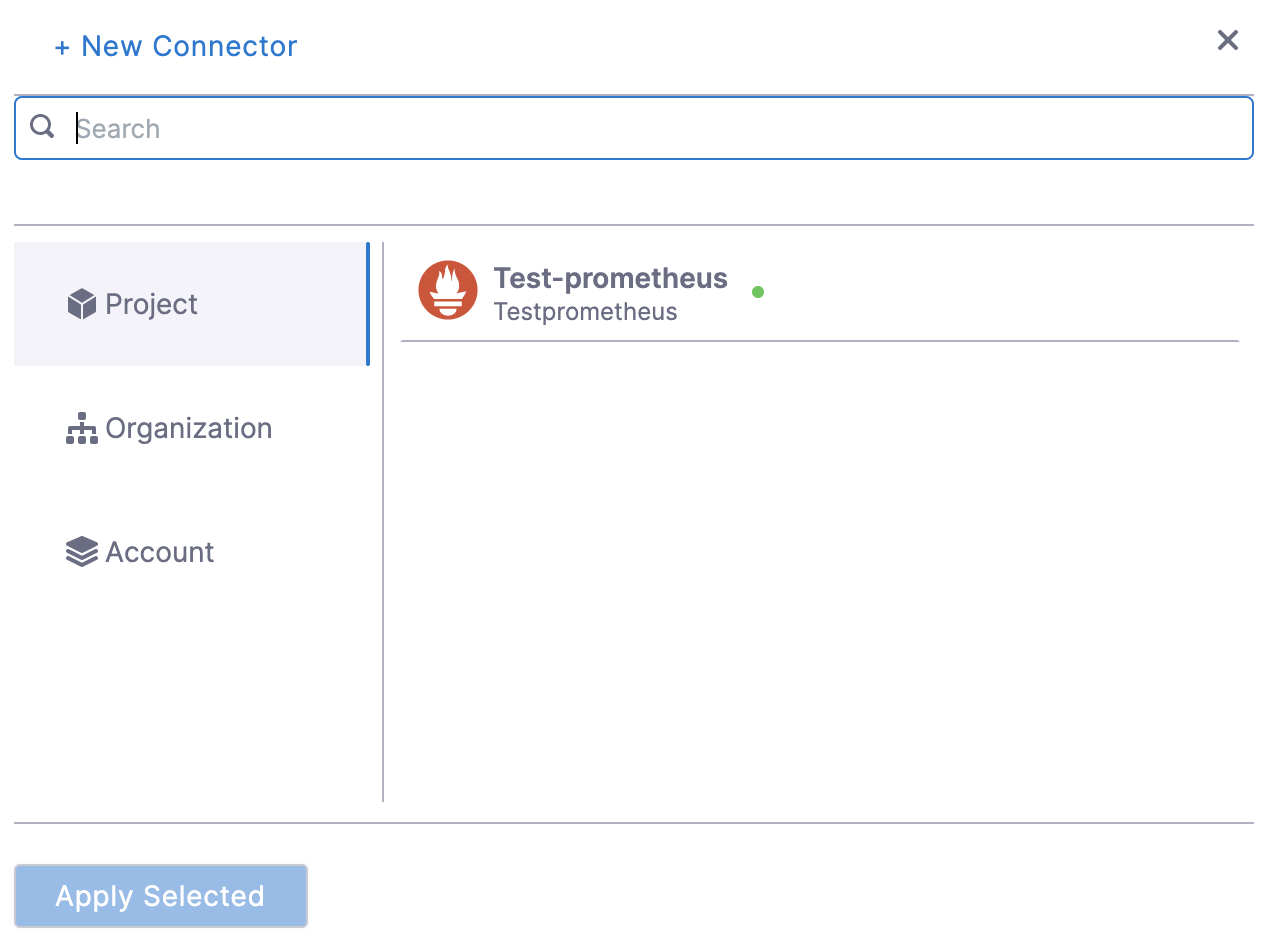
- After selecting the connector, click Apply Selected. The Connector is added to the Health Source.
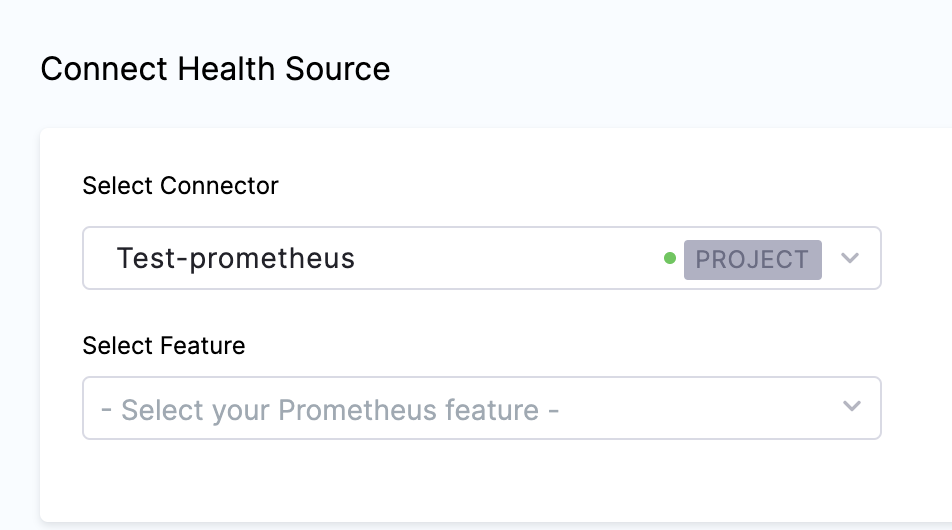
- In Select Feature, select the Prometheus feature to be used.
- Click Next. The Customize Health Source settings appear.
The subsequent settings in Customize Health Source depend on the Health Source Type you selected. You can customize the metrics to map the Harness Service to the monitored environment.
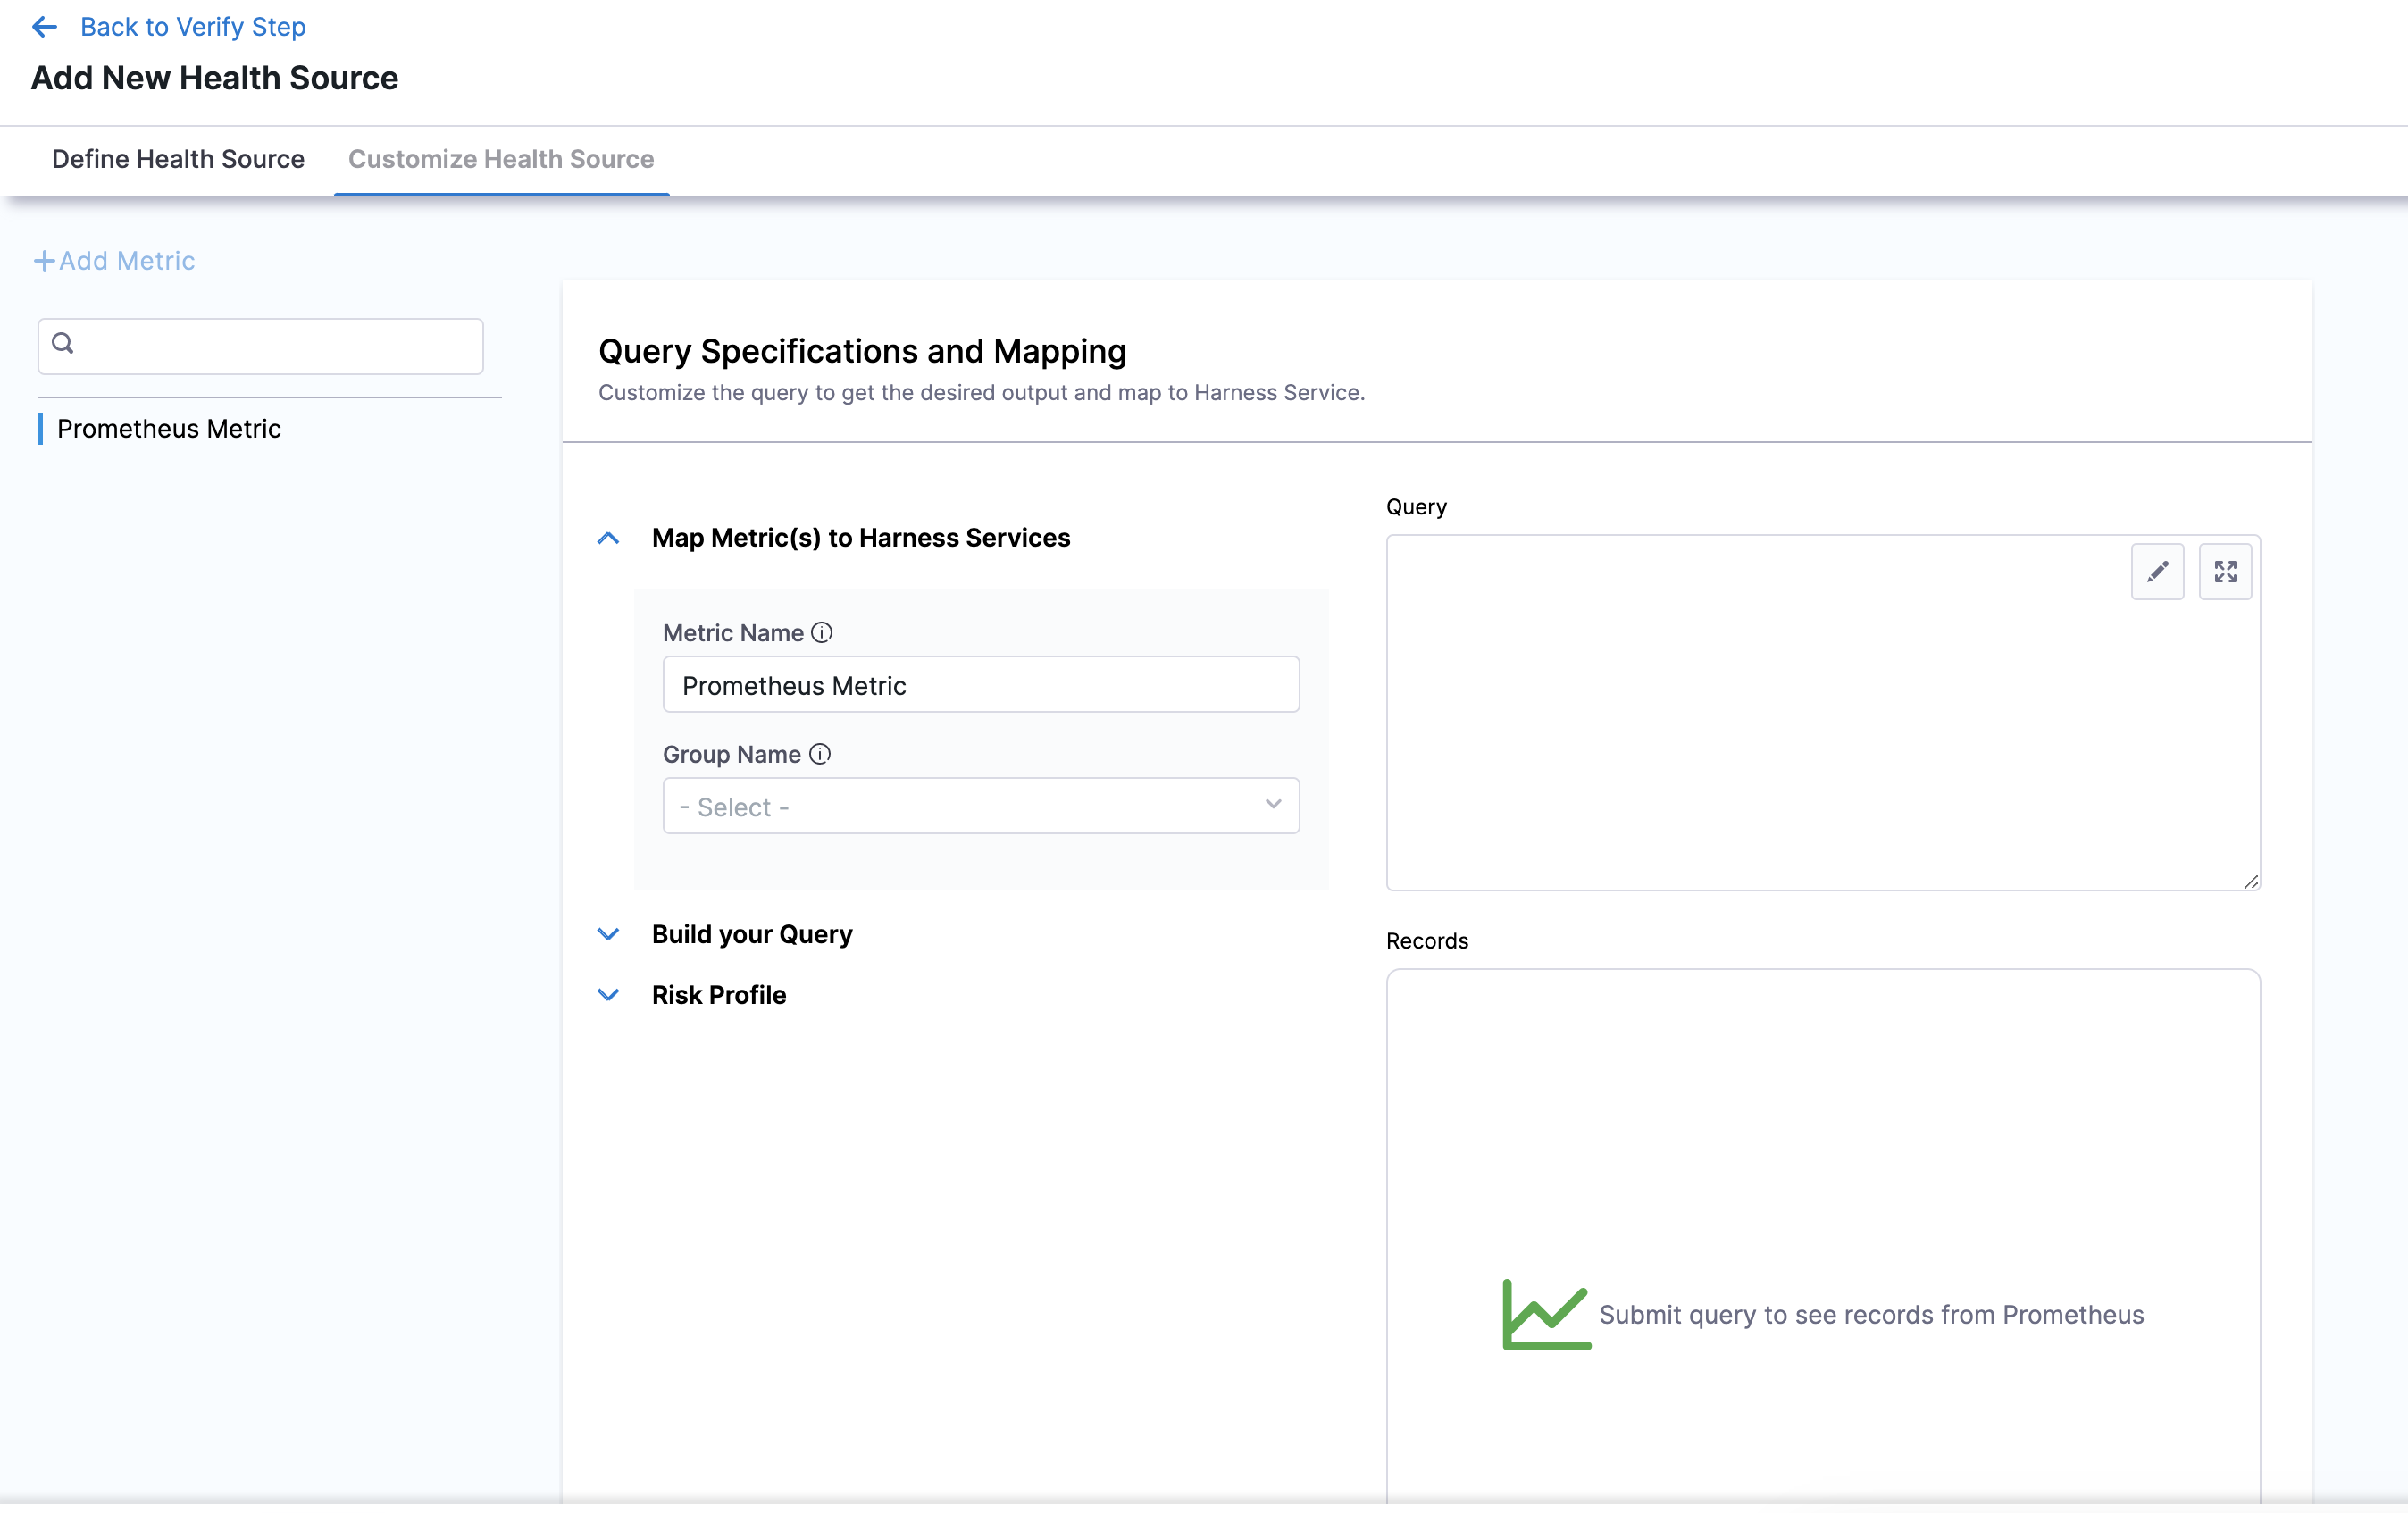
- In Query Specifications and Mapping, first click Map Metric(s) to Harness Services.
- Enter the desired metric name in Metric Name.
- Enter a name for the Prometheus group in Group Name.
- Click Build your Query drop down.
- In Prometheus Metric, select the Prometheus metric.
- In Filter on Environment, select a filter.
- In Filter on Service, select a filter. To add more filters, click Additional Filter which is optional.
- To add an aggregator for the metric, click Aggregator which is also optional.
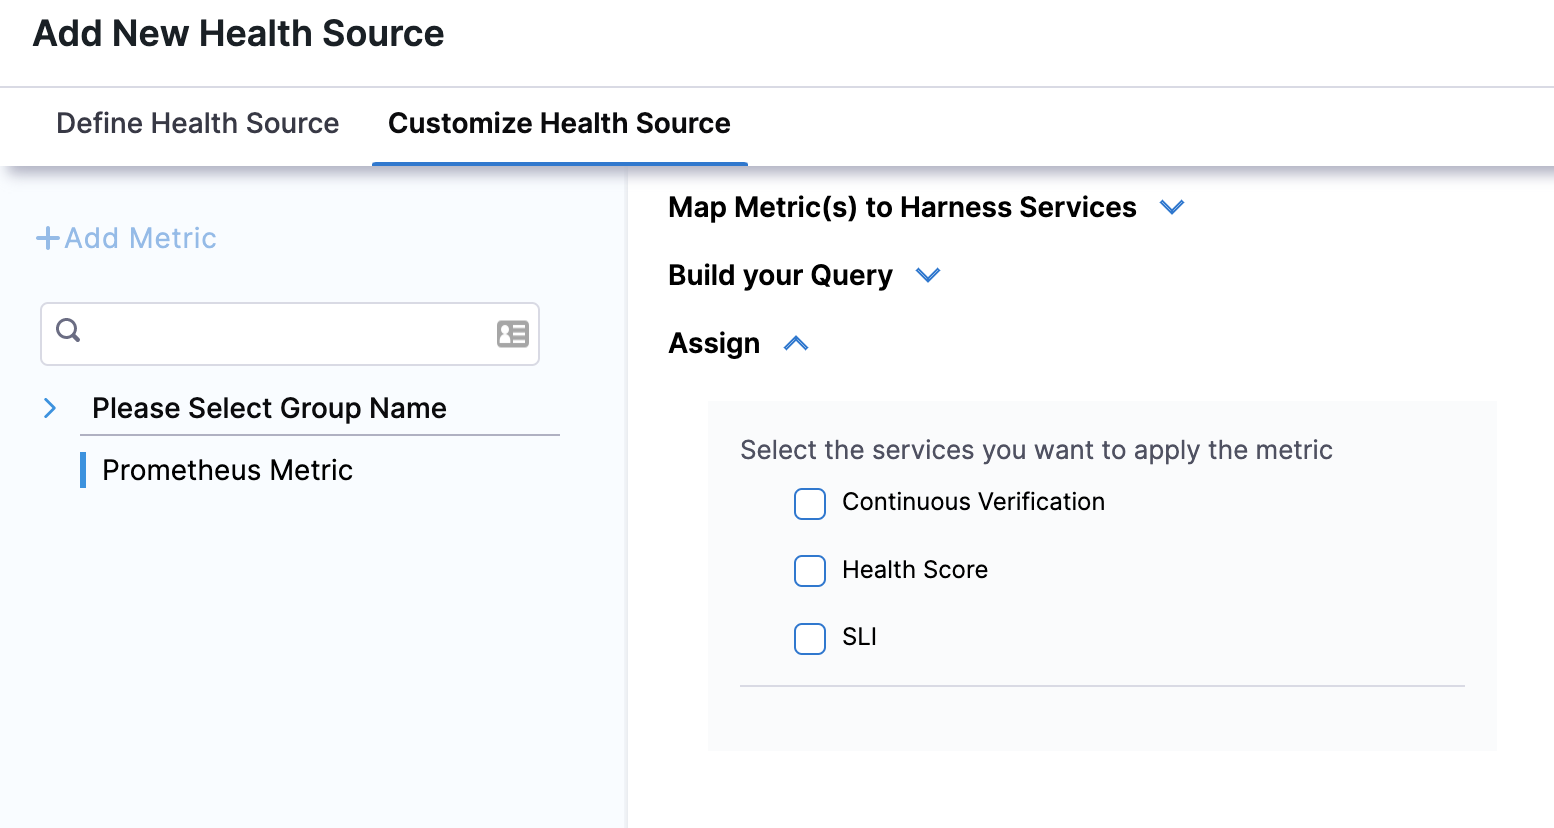
- In Assign, you can select the services for which you want to apply the metric.
- Click Submit. The Prometheus health source gets added to the monitored service.
You can add multiple health sources.
Add Amazon Managed Service for Prometheus as health source
Harness now supports Amazon Managed Service for Prometheus as health source. To select Amazon Managed Service for Prometheus as health source:
-
In Health Sources, click Add.
The Add New Health Source settings appear. -
In Select health source type, select Prometheus.
-
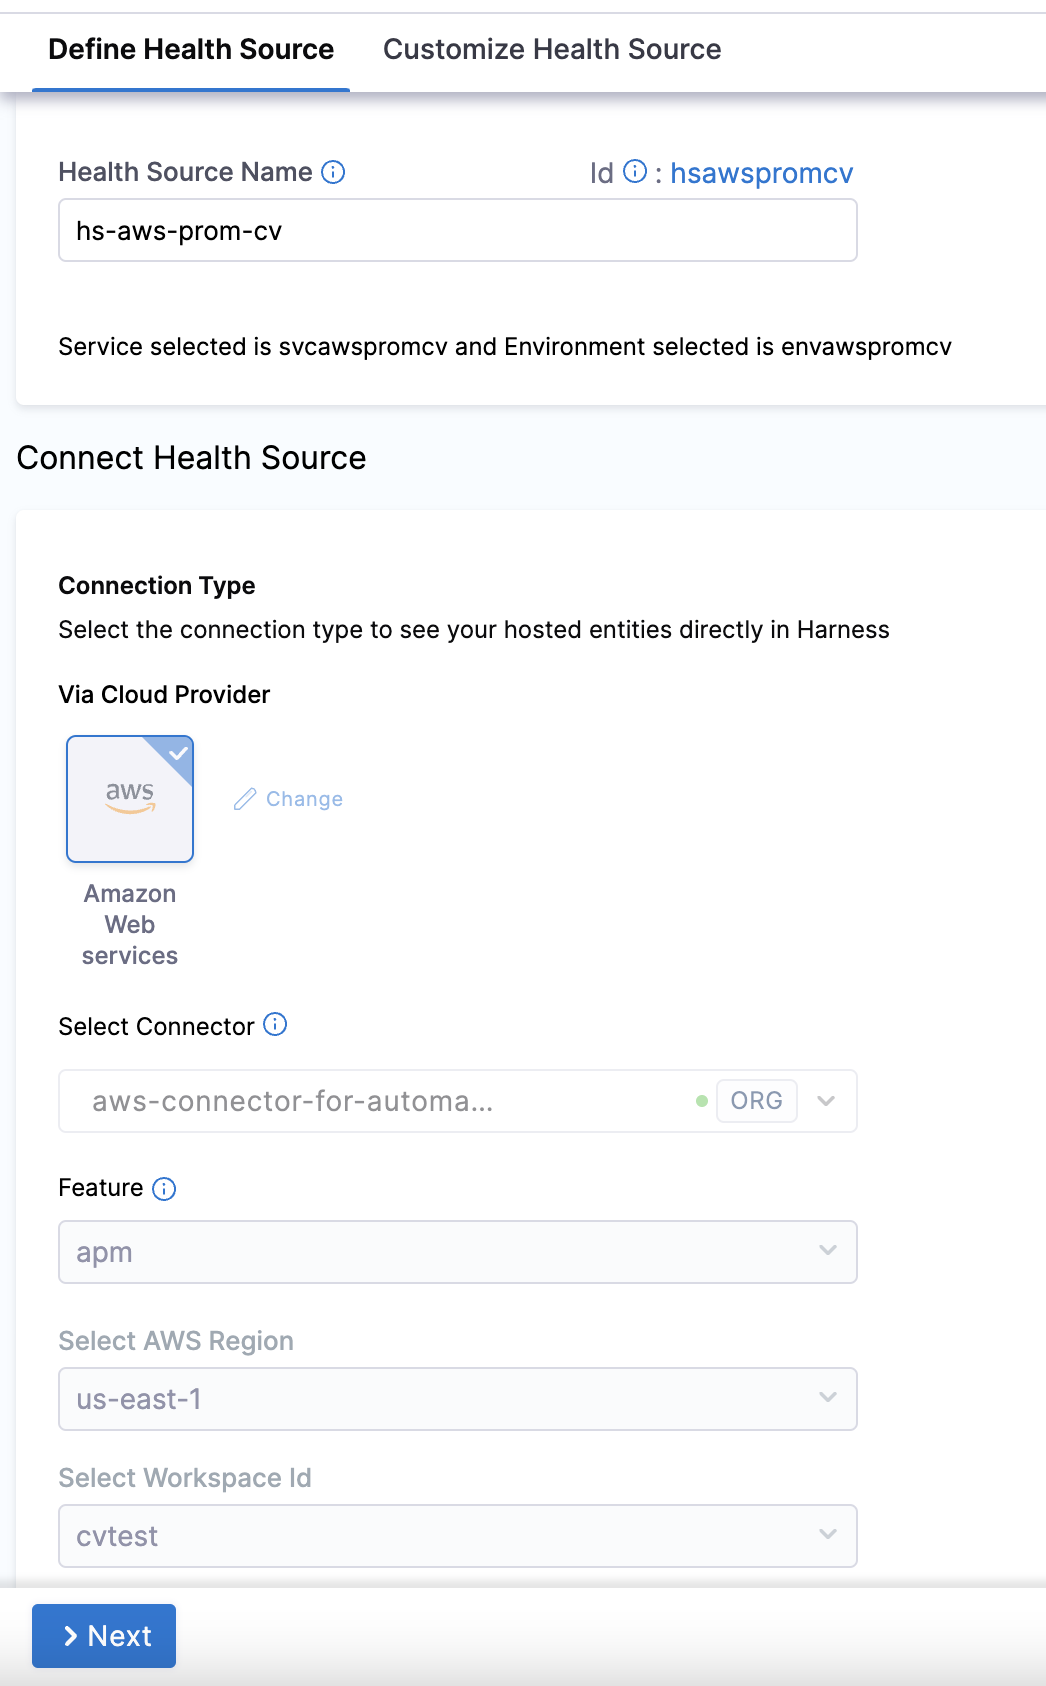
In Health Source Name, enter a name for the Health Source.
-
Under Connect Health Source > Via Cloud Provider, select Amazon web services.
-
Under Connect Health Source, click Select Connector.
-
In Connector settings, you can either choose an existing connector or click New Connector.
-
In the Select Feature field, select the Prometheus feature that you want to use.
-
In the Select AWS Region field, select the appropriate region.
-
In the Select Workplace Id field, select the appropriate workplace id.
-
Click Next. The Customize Health Source settings appear.
You can customize the metrics to map the Harness Service to the monitored environment in Query Specifications and Mapping settings. The subsequent settings in Customize Health Source depend on the Health Source Type you selected. Click Map Queries to Harness Services dropdown. -
Click Add Metric.
-
Enter a name for the query in Name your Query.
-
Click Select Query to select a saved query. This is an optional step. You can also enter the query manually in the Query field.
-
Click Fetch Records to retrieve the details. The results are displayed under Records.