Generate and Manage Software Bill of Materials (SBOM)
A Software Bill of Materials (SBOM) is an exhaustive list of all components, libraries, and other dependencies utilized in a software application. The SBOM Orchestration step within Harness SCS facilitates the generation of SBOMs for your software artifacts and code repositories.
If you already possess an SBOM and wish to ingest it, please refer to the Ingest SBOM section.
In the SBOM, dependency names may differ from their original source names, as SBOM tools sometimes list dependencies under a product or bundle name rather than the actual dependency name.
SBOM Orchestration step configuration
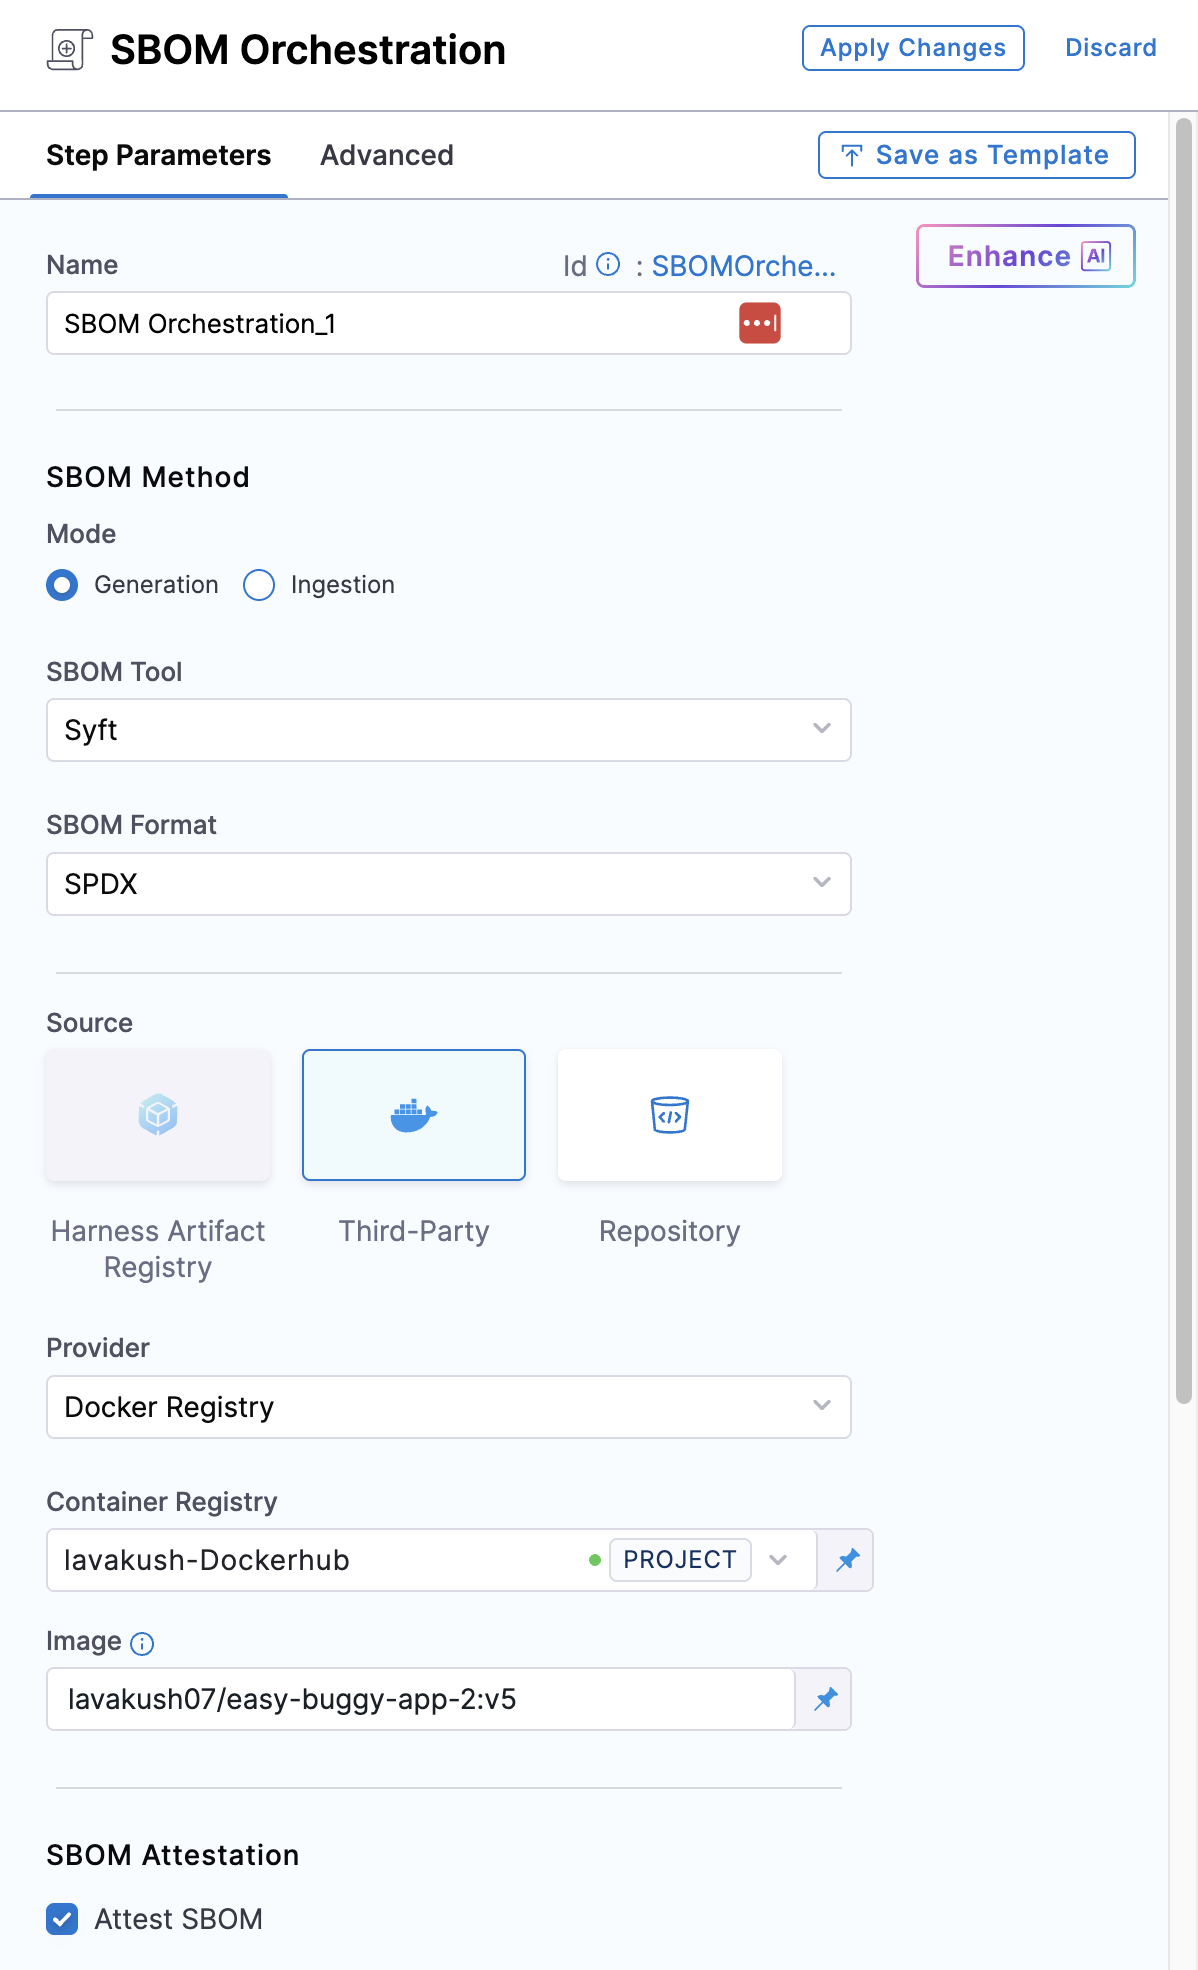
You can use SBOM Orchestration step to generate an SBOM in either the Build or Deploy stage of a Harness pipeline.
- In a Build stage, add the SBOM Orchestration step after the artifact (image) has been pushed to an artifact repository.
- In a Deploy stage, add the SBOM Orchestration step before the deployment step.
SBOM Orchestration step in deploy stage can only be used in the Containerized Step Groups and ensure you enable the container based execution.
Using SBOM Orchestration step you can generate the SBOM for both Container images and Repositories. Follow the steps to configure the fields for each supported type.
-
Name: Enter a name for the step.
-
Step Mode: Select Generation.
-
SBOM Tool: Select Syft or cdxgen. For other SBOM tools, go to Ingest SBOM.
-
SBOM Format: Select SPDX or CycloneDX.
If you're using Syft to generate the SBOM and want to ensure it includes all component licenses with high accuracy, you'll need to set specific environment variables based on your project's programming language. Here are the relevant variables:
Set variables for enhanced SBOM
Programming Language Name of Variable Value Go SYFT_GOLANG_SEARCH_REMOTE_LICENSEStrue Java SYFT_JAVA_USE_NETWORKtrue JavaScript SYFT_JAVASCRIPT_SEARCH_REMOTE_LICENSEStrue To add a new environment variable, go to Overview section of your Build stage, and expand the Advanced section.
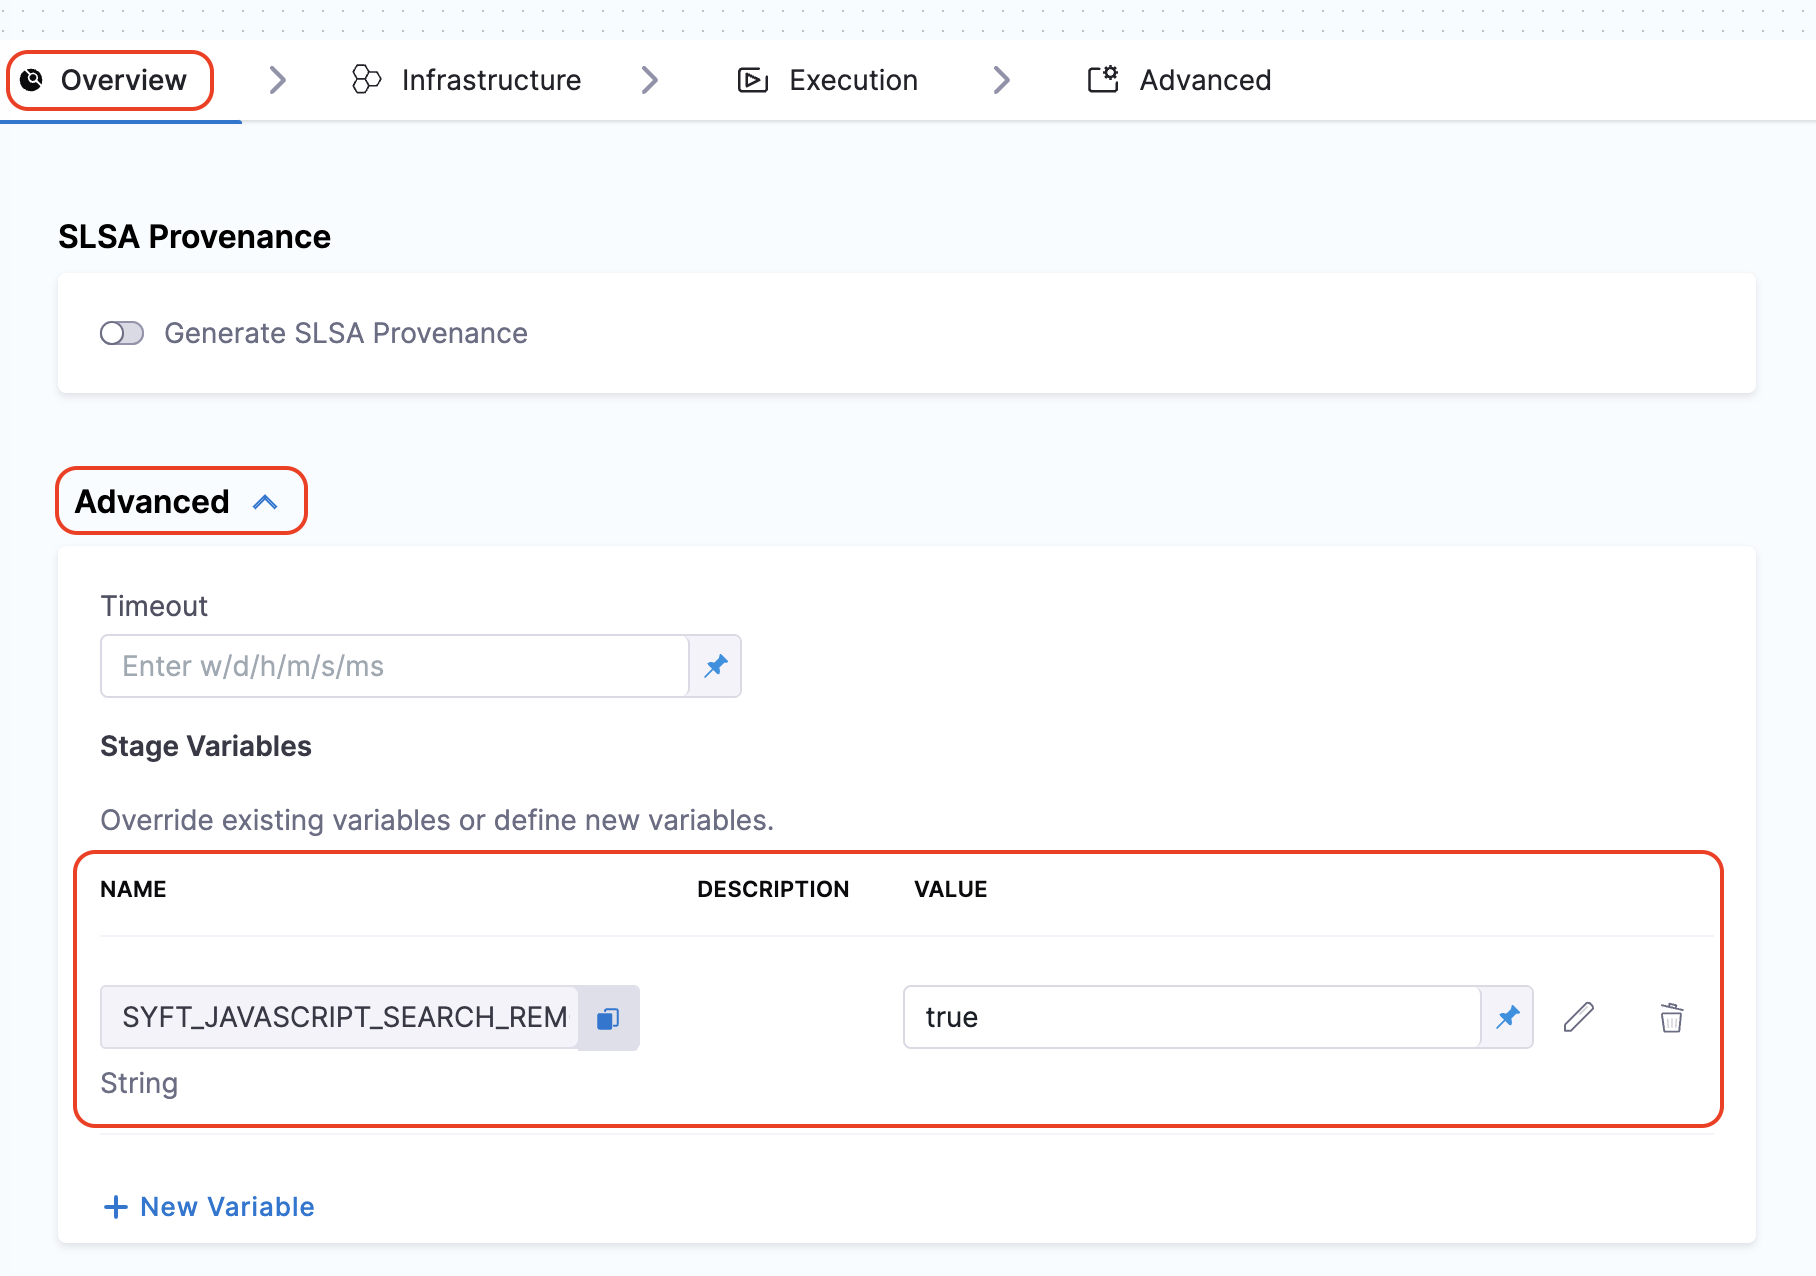
By setting these variables, Syft can more effectively fetch and populate the licensing data for the components in your SBOM. This not only enhances the quality of the SBOM but also improves its overall SBOM score. If your SBOM contains
NOASSERTIONS, it indicates that Syft was unable to retrieve necessary data.
- Registry Type: Select Harness Artifact Registry or Third-Party Artifact Registry, based on where your artifact is stored.
- Source: Select the Source by choosing either a supported container registry from the list or Repository if you are generating the SBOM for source code.
- HAR
- Docker Registry
- ECR
- GAR
- ACR
-
Registry: Select the Harness Registry configured for the Harness Artifact Registry where your artifact is stored.
-
Image: Enter the name of your image with tag or digest, such as
imagename:tagorimagename:digest.
-
Container Registry: Select the Docker Registry connector that is configured for the DockerHub container registry where the artifact is stored.
-
Image: Enter the name of your image using either a tag or a digest. For example:
my-docker-org/repo-name:tagormy-docker-org/repo-name@sha256:<digest>
Unlike other artifact sources, JFrog Artifactory requires additional permissions for attestation. The connector’s user or token must have Read, Annotate, Create/Deploy, and Delete permissions.
-
Container Registry: Select the Docker Registry connector that is configured for the Elastic container registry where the artifact is stored.
-
Image: Enter the name of your image with tag or digest for the image for which you're generating an SBOM, such as
my-docker-repo/my-artifact:latestormy-docker-repo/my-artifact@sha256:<digest>. -
Region: The geographical location of your ECR repository.
-
Account ID: The unique identifier associated with your AWS account.
-
Container Registry: Select the Docker Registry connector that is configured for the Google artifact registry where the artifact is stored.
-
Image: Enter the name of your image with tag or digest for which you're generating the SBOM, example
repository-name/image:tagorrepository-name/image@sha256:<digest>. -
Host: Enter your GAR Host name. The Host name is regional-based. For example,
us-east1-docker.pkg.dev. -
Project ID: Enter the unique identifier of your Google Cloud Project. The Project-ID is a distinctive string that identifies your project across Google Cloud services. example:
my-gcp-project
OIDC Auth type is not supported.
-
Container Registry: Select the Docker Registry connector that is configured for the Azure container registry where the artifact is stored.
-
Image: Enter your image details with a tag or digest in the format
<registry-login-server>/<repository>:<tag>or<registry-login-server>/<repository>@sha256:<digest>. The<registry-login-server>is a fully qualified name of your Azure Container Registry. It typically follows the format<registry-name>.azurecr.io, where<registry-name>is the name you have given to your container registry instance in Azure. Example input:automate.azurecr.io/acr:test -
Subscription Id: Enter the unique identifier that is associated with your Azure subscription.
OIDC Auth type is not supported.
With this configuration, the step generates the SBOM and stores it in the Artifact section of SCS. Optionally, you can attest to the generated SBOM, follow the instructions in the section below.
The SBOM generation step supports all registry types, including JFrog, Harbor, and Kubernetes registries. Select the Docker Registry Connector that is configured for the Docker Registry where the artifact is stored.
Enter the name of your image with tag, such as:
JFrog: </your-repo/test-image>:tag
Harbor: </your-project/test-image>:tag
Attest the SBOM
To configure attestation, in addition to the above configuration, you need to enable the SBOM Attestation checkbox in the SBOM Orchestration step. Enabling SBOM Attestation is optional and not required for SBOM generation.
Attestation process requires a key pair generated using Cosign. You can perform the attestation with Cosign or Cosign with Secret Manager
- Cosign
- Cosign with Secret Manager
To perform attestation with Cosign selected, you need a key pair. Follow the instructions below to generate the key pair. To perform the attestation process, you need to input the private key and password. Use Cosign to generate the keys in the ecdsa-p256 format. Here’s how to generate them:Generate key pairs using Cosign for SBOM attestation
cosign generate-key-pair to generate the key pairs..key file and a public key as a .pub file. To securely store these files, use Harness file secret.
- Private Key: Input your Private key from the Harness file secret.
- Password: Input your Password for the Private key from the Harness file secret.
In this mode, you can pass your Cosign keys using a Secret Manager. Currently, SCS supports only the HashiCorp Vault secret manager. You can connect your Vault with Harness using the Harness HashiCorp Vault connector. Here are the key points to consider when connecting your Vault:
- Enable the Transit Secrets Engine on your HashiCorp Vault. This is essential for key management and cryptographic operations.
- Configure your HashiCorp Vault connector using the following authentication methods AppRole, Token , JWT Auth or Vault Agent.
- Create a Cosign key pair of type
ecdsa-p256,rsa-2048, orrsa-4096in the Transit Secrets Engine. You can do this in two ways:- CLI: Run the command:
vault write -f <transit_name>/<key_name> type=ecdsa-p256 - Vault UI: Create the key pair directly from the Vault interface.
- CLI: Run the command:
- Ensure the Vault token generated has the required policy applied for Cosign to perform attestation operations.
Harness Vault Connector now supports fetching keys from Vault subfolder paths. This feature is behind the FF SSCA_COSIGN_USING_VAULT_V2. To enable it contact Harness Support, and also ensure to upgrade your Harness delegate version to 25.10.87000 or higher.
Configure the following fields in the step to perform the attestation
- Connector: Select the HashiCorp Vault connector.
- Key: Enter the path to the Transit Secrets Engine in your HashiCorp Vault where the keys are stored.
Harness Vault Connector is supported only for Kubernetes and VM infrastructure. Ensure your Harness delegate is on version 25.10.87000 or higher.
Configure SBOM Drift
This feature allows you to track changes in SBOMs by comparing against the last generated SBOM. It provides a detailed analysis of addition or removal of components and licenses, helping you manage and oversee software artifacts more effectively. However, this is optional and not required for SBOM generation. If you prefer not to detect changes in SBOMs, leave this option unchecked.

When SBOM and SLSA attestation steps run in parallel, only one attestation layer may be uploaded to the container registry due to a race condition in Cosign.
Recommended approach:
- Run the SBOM and SLSA attestation steps sequential rather than in parallel way to avoid SLSA verification or SBOM policy enforcement failures.
- Place the SLSA generation step just after the Docker Build and Push step.
Run the pipeline
When the pipeline runs, the SBOM Orchestration step performs the following actions:
- Generates an SBOM in the chosen format for both Containers and Repositories.
- Specifically for Containers:
- Generates and signs an attestation using the provided private key and password.
- Stores the SBOM in Harness and uploads the
.attfile to your container registry.
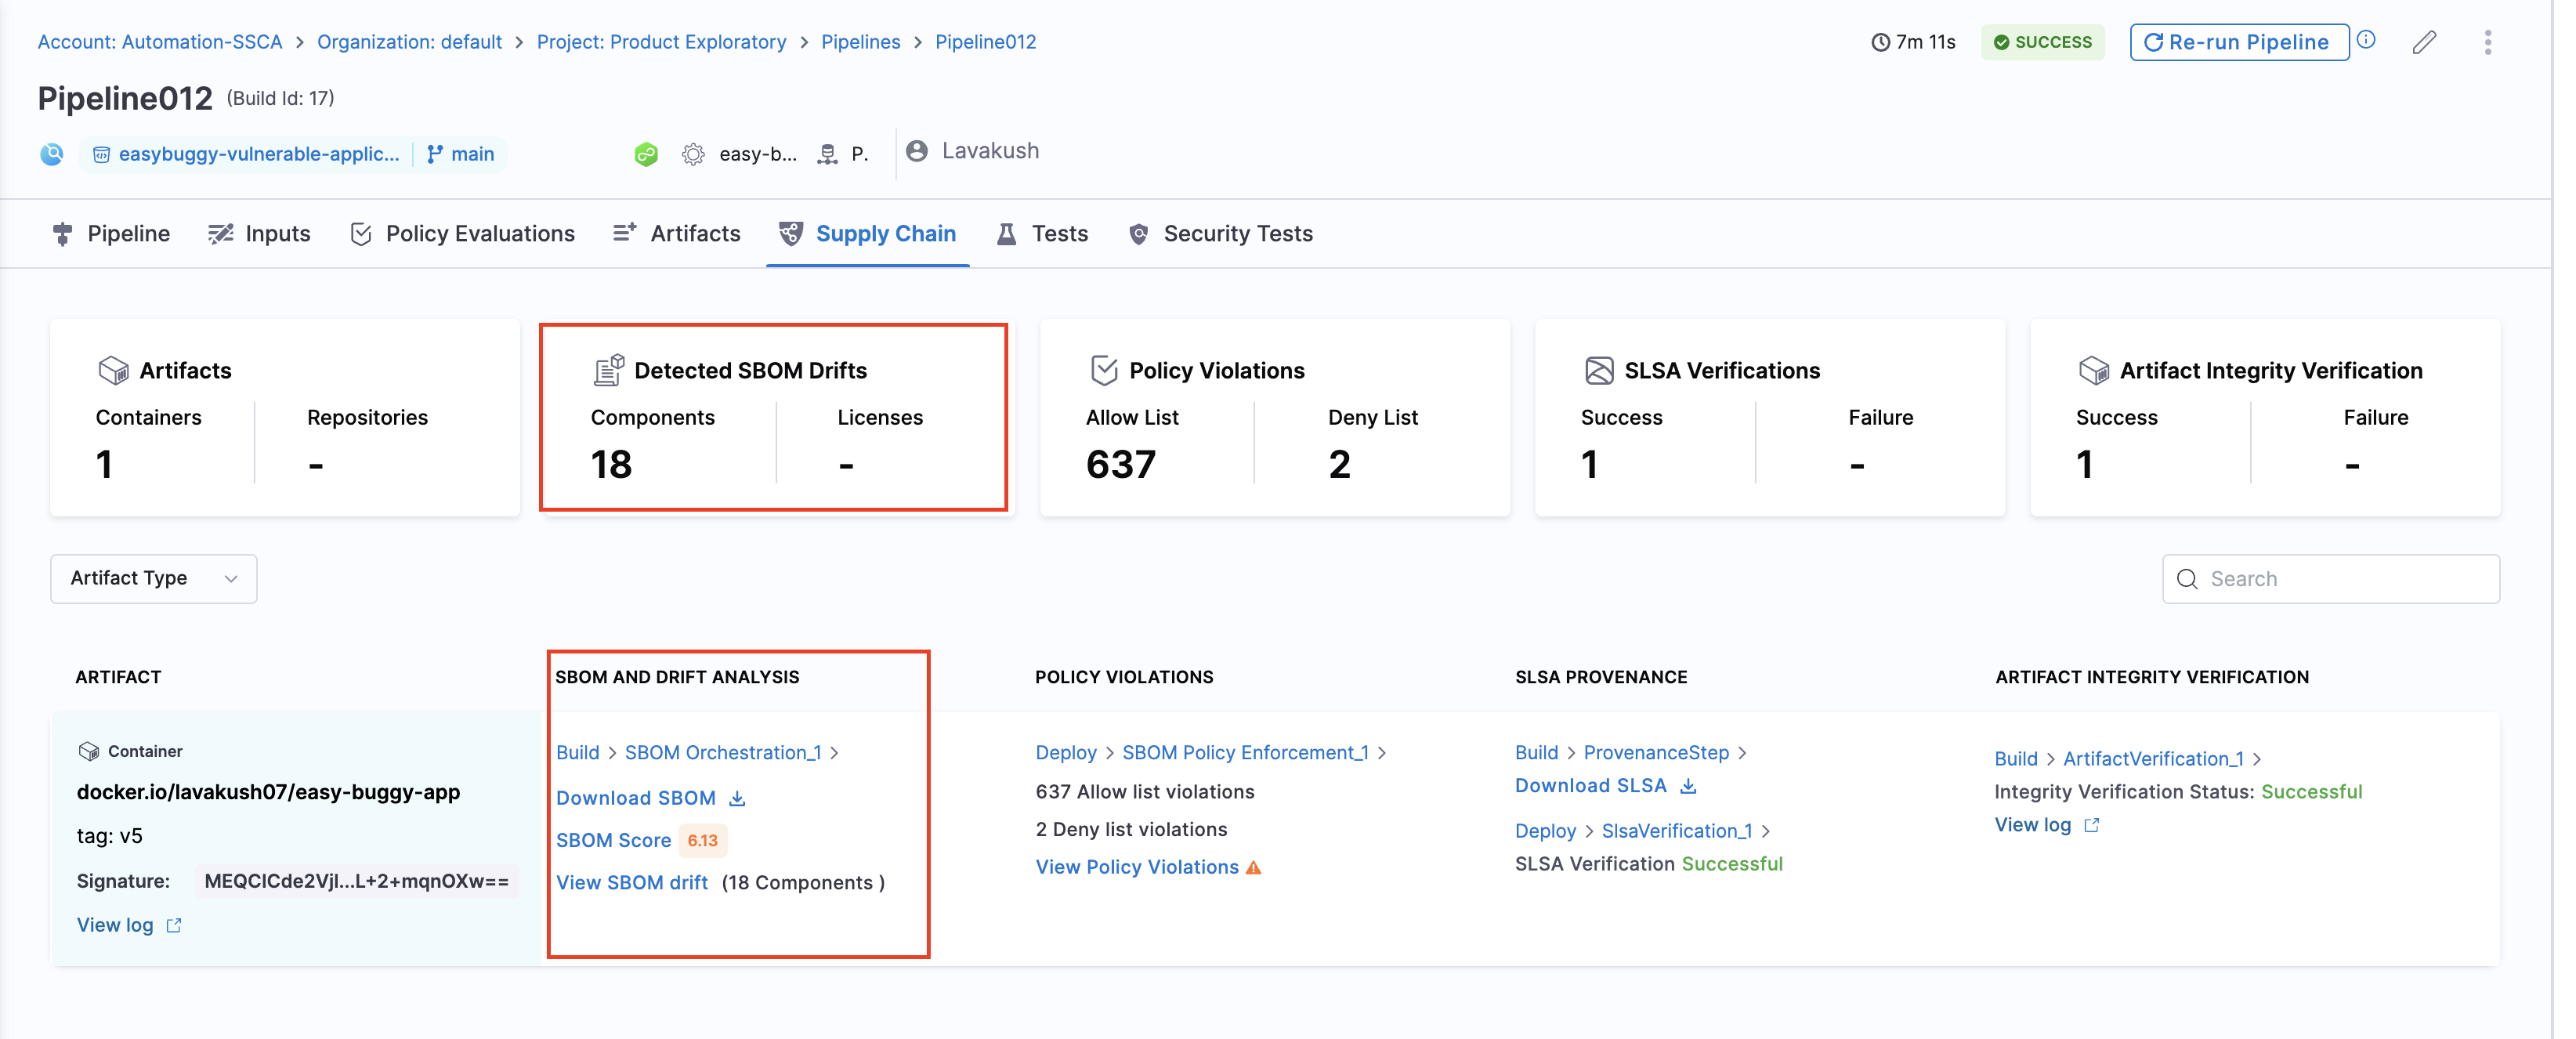
SBOMs for both Containers and Code Repositories are accessible in the Artifacts view. Additionally, you can locate the SBOM for any artifact on the Supply Chain tab within the Execution Details page in Harness.
Example Pipeline for SBOM generation
These example demonstrate how you could set up Build and Deploy stages to generate SBOM.
- Build stage
- Deploy stage
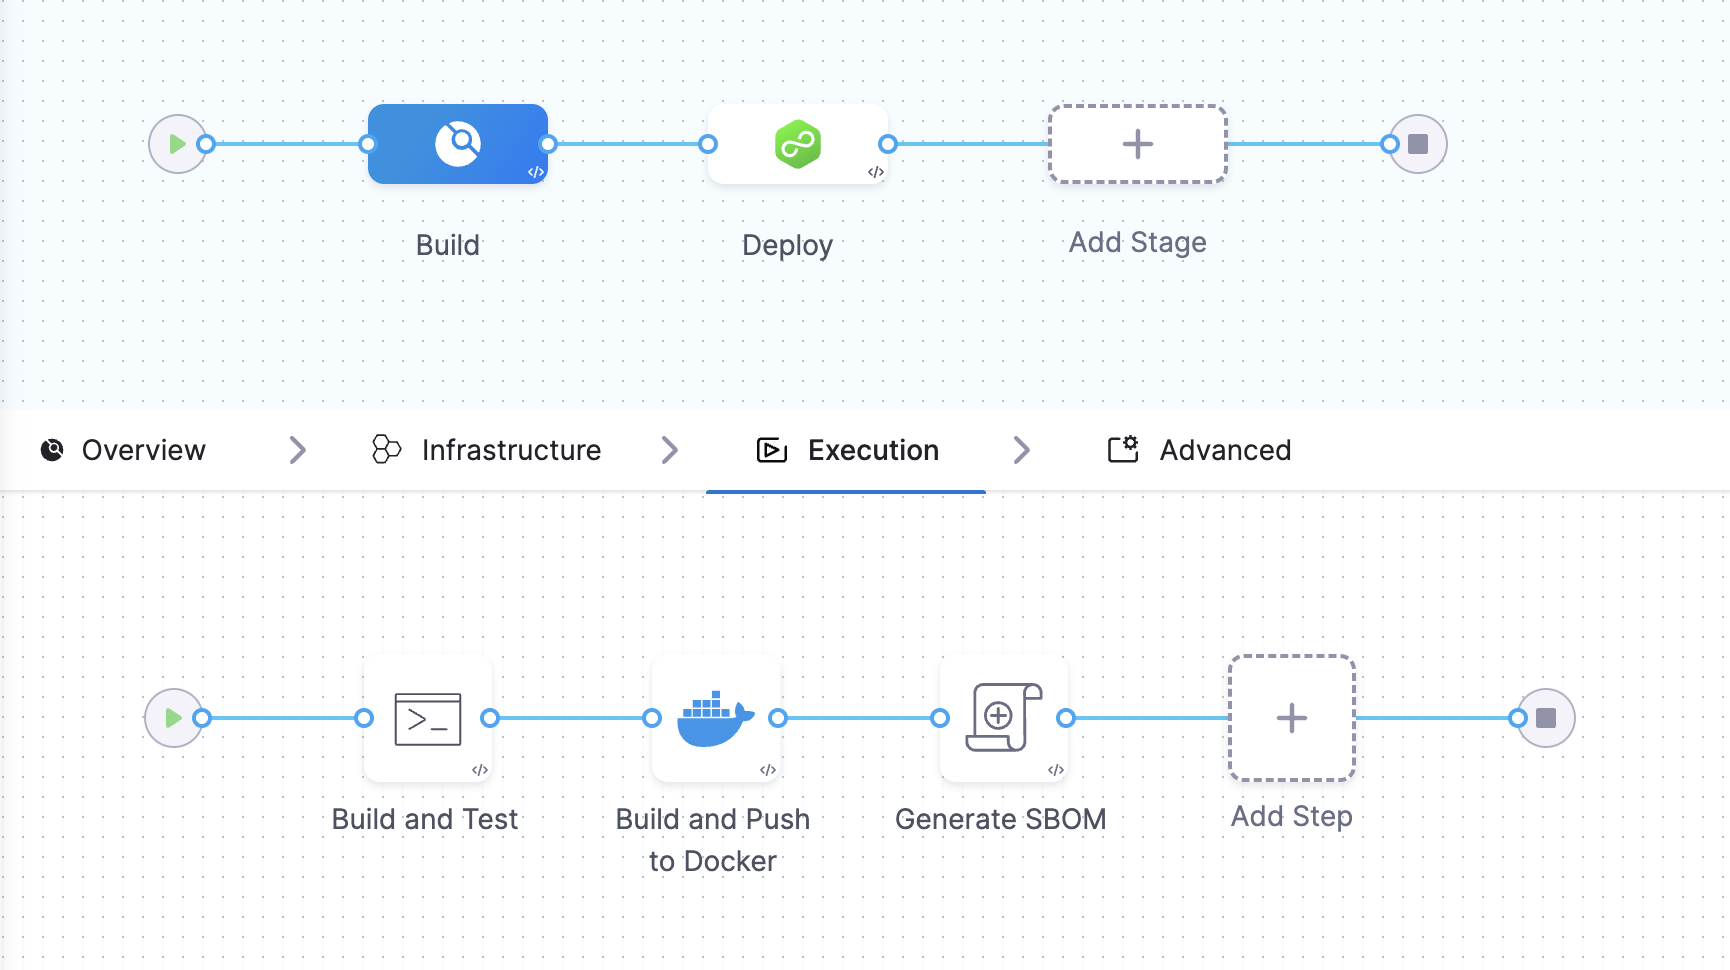
This example Build stage has three steps:
- Run step: Build and test an artifact (image).
- Build and Push an image to Docker Registry step: Build and push the image to a Docker registry.
- SBOM Orchestration step: Generate the SBOM.
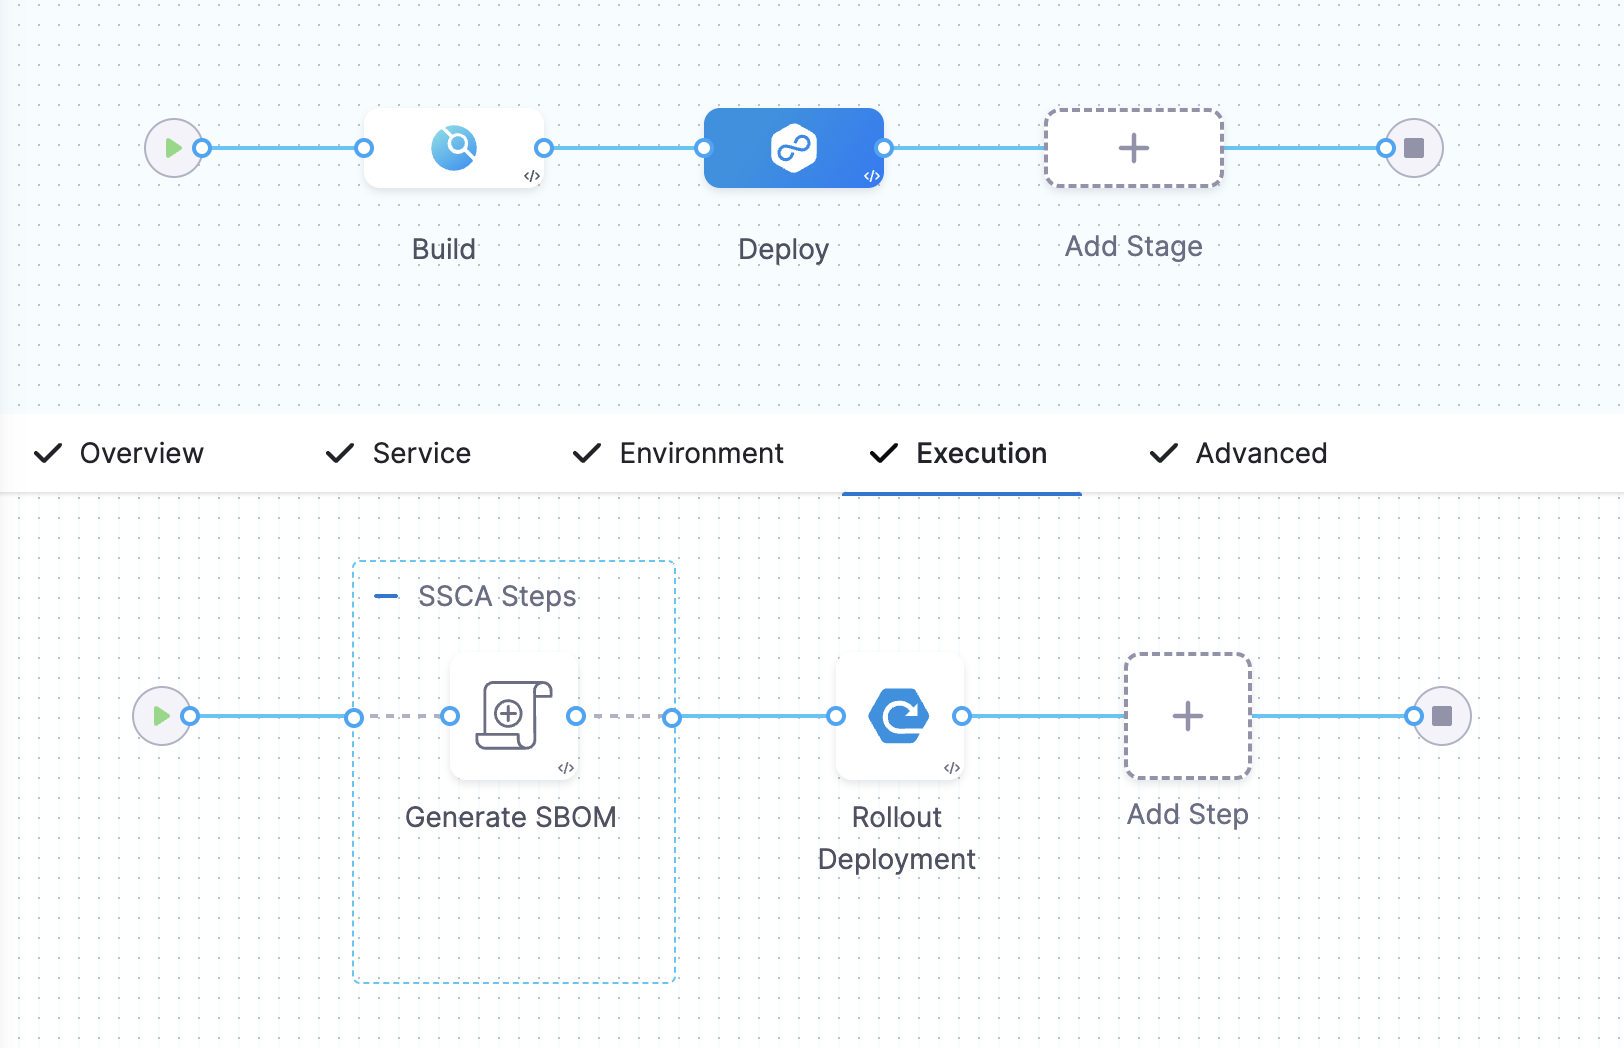
SBOM Orchestration in deploy stage can only be used in the Containerized Step Groups This example Deploy stage has two steps:
- SBOM Orchestration step: Generate the SBOM.
- Rolling deployment step: Deploy the image.
View vulnerabilities in the SBOM
After you run the SBOM orchestration step followed by the STO Snyk scan, the SBOM tab on the Artifacts page displays vulnerabilities for the components identified by Snyk. This helps you effectively identify and prioritize open source risks
Publish SBOM
After you run the SBOM Orchestration step, you can download or publish SBOM through multiple ways depending on your workflow:
- Via Harness API
- Use the Download SBOM button available on the Artifacts page.
- Download the SBOM score for an artifact via Harness API
- Access the SBOM file directly from the pipeline output, generated under the default
/harnessworking directory and is available at/harness/harness/sbom/{sbom_<sbom_orchestration_step_execution_id>}.json.
Next steps
After generating an SBOM, you can apply SBOM Policy Enforcement to achieve open source governance.