Datadog
Before you begin
This page assumes you have followed the rest of the steps to set up CV. To learn more, go to Configure CV
Also, Add Datadog as a verification provider
Add Datadog as a health source
This option is available only if you have configured the service and environment as fixed values.
A Health Source is basically a mapping of a Harness Service to the service in a deployment environment monitored by an APM or logging tool.
In Health Sources, click Add. The Add New Health Source settings appear.
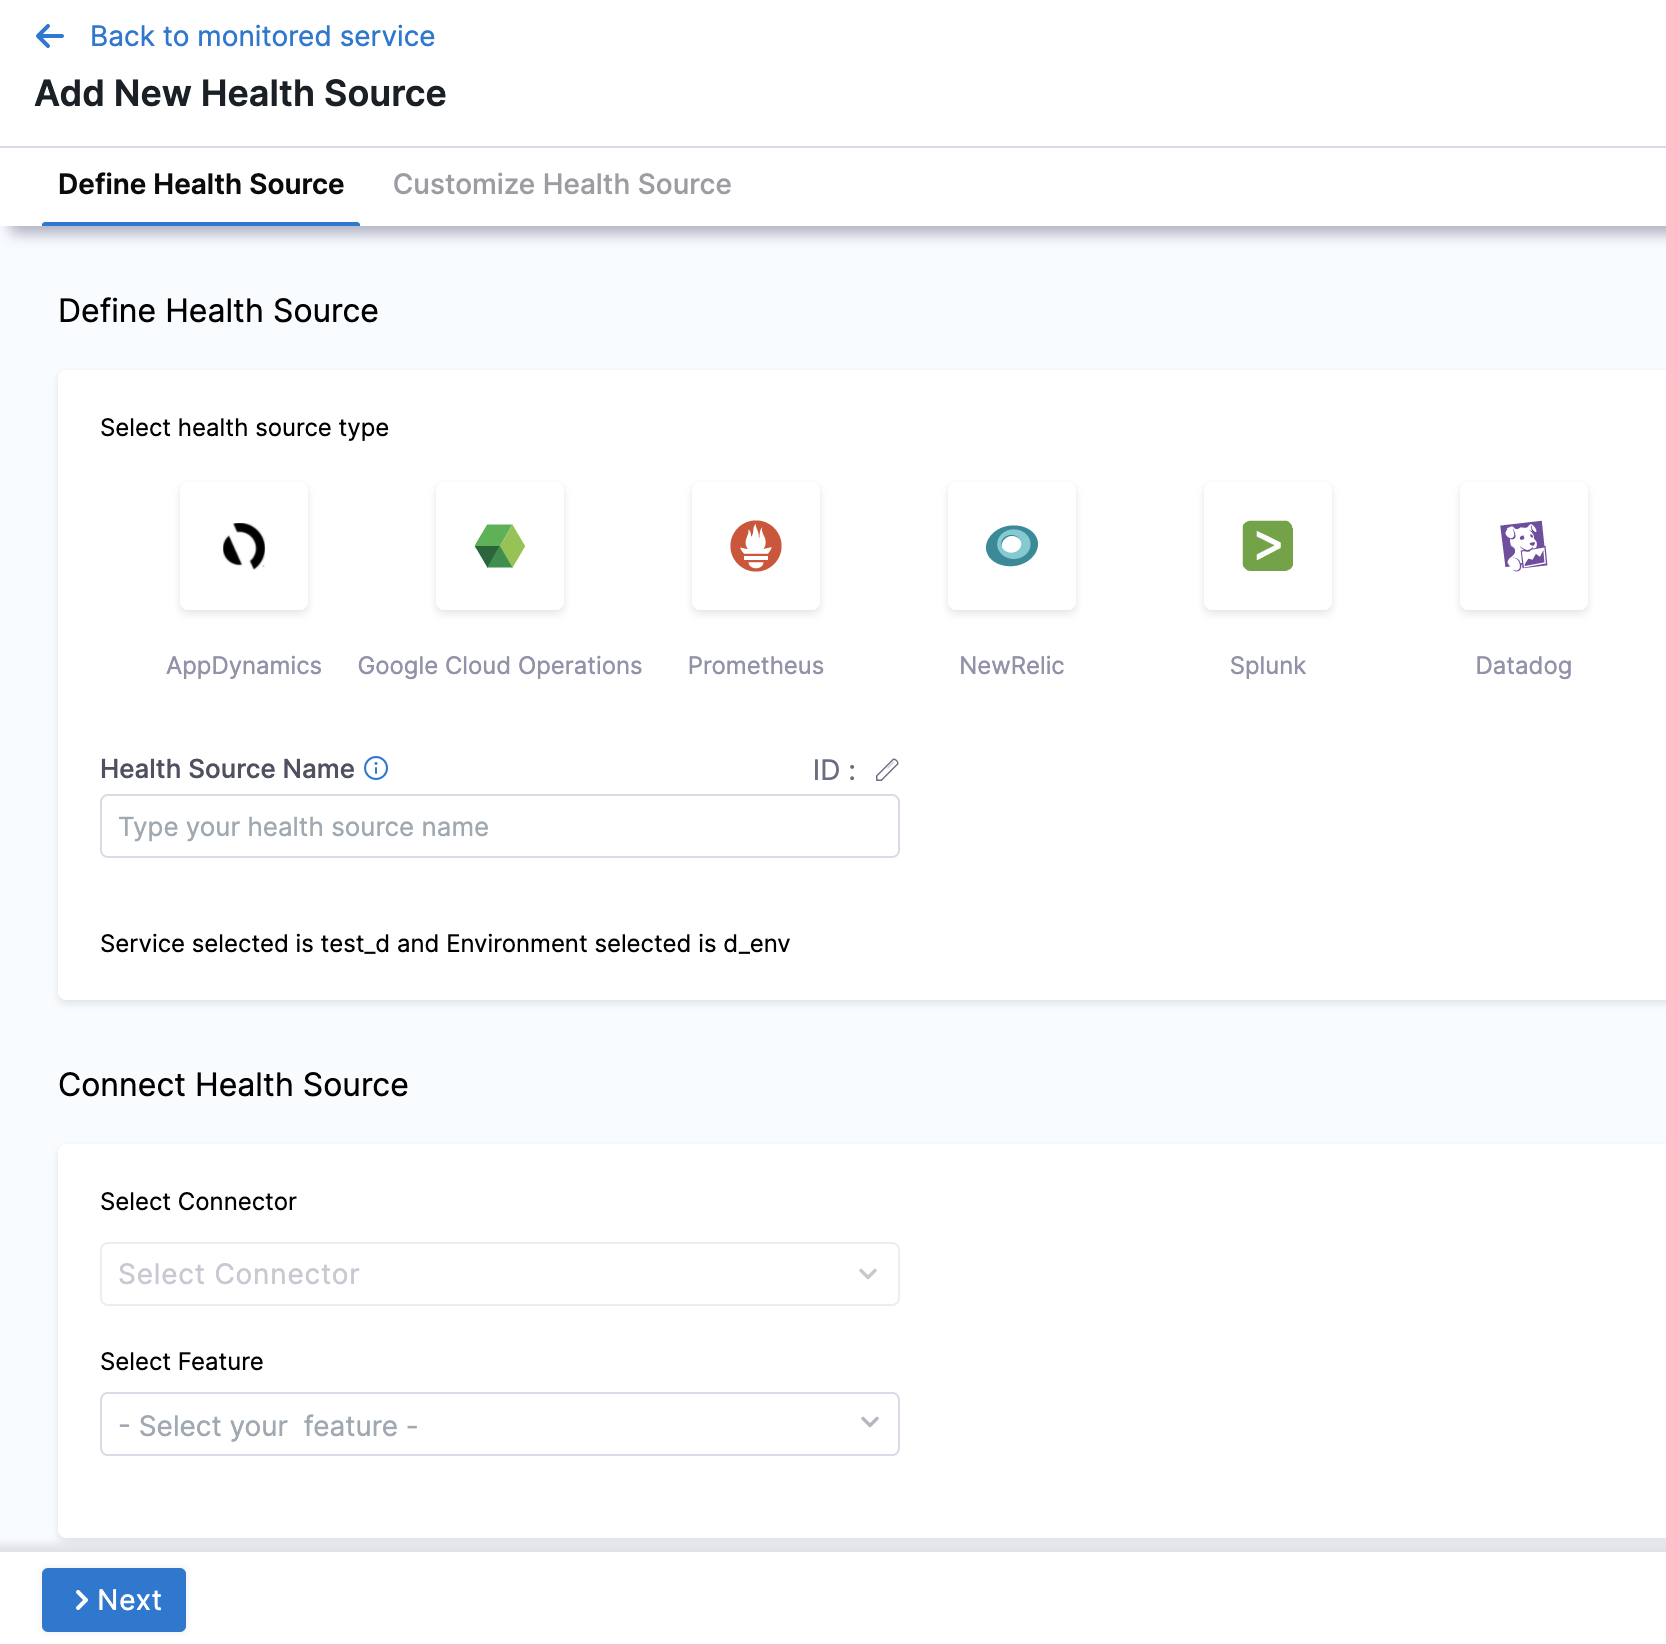
In Select health source type, select Datadog.
In Health Source Name, enter a name for the Health Source.
Under Connect Health Source, click Select Connector.
In Connector settings, you can either choose an existing connector or click New Connector.
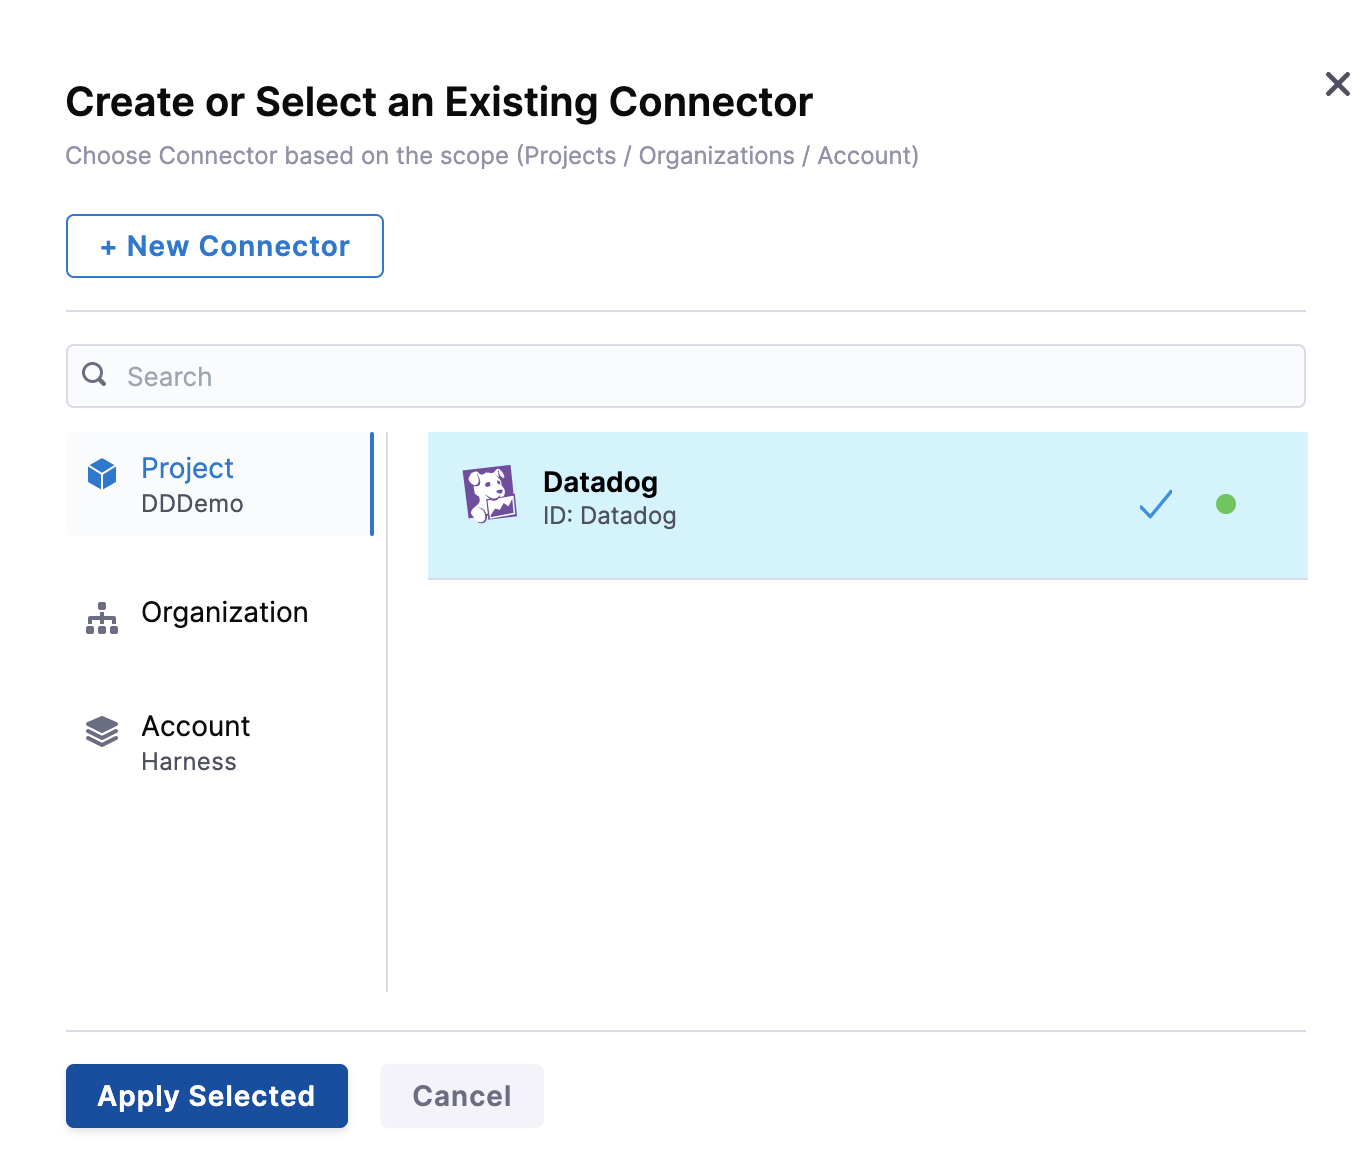
Click Apply Selected. The Connector is added to the Health Source.
In Select Feature, select the Datadog feature to be used. You can choose Cloud Metrics or Cloud Logs.
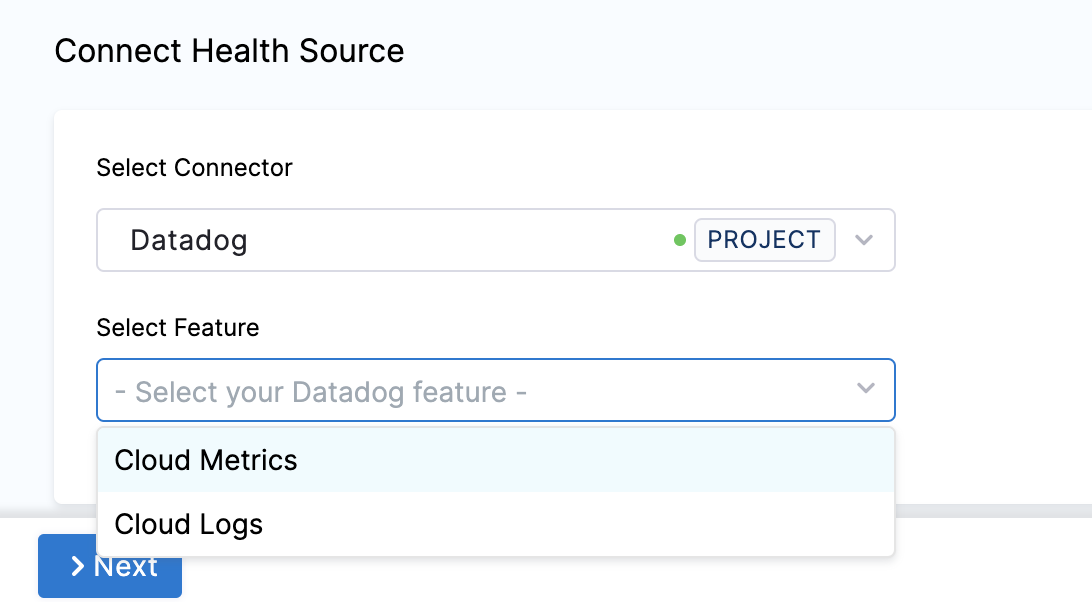
Click Next.
The subsequent settings in Customize Health Source depend on the Health Source Type you selected. ### Option: Cloud Metrics
If you select Cloud Metrics, the Select Dashboards settings appear. It displays a list of Datadog dashboards.
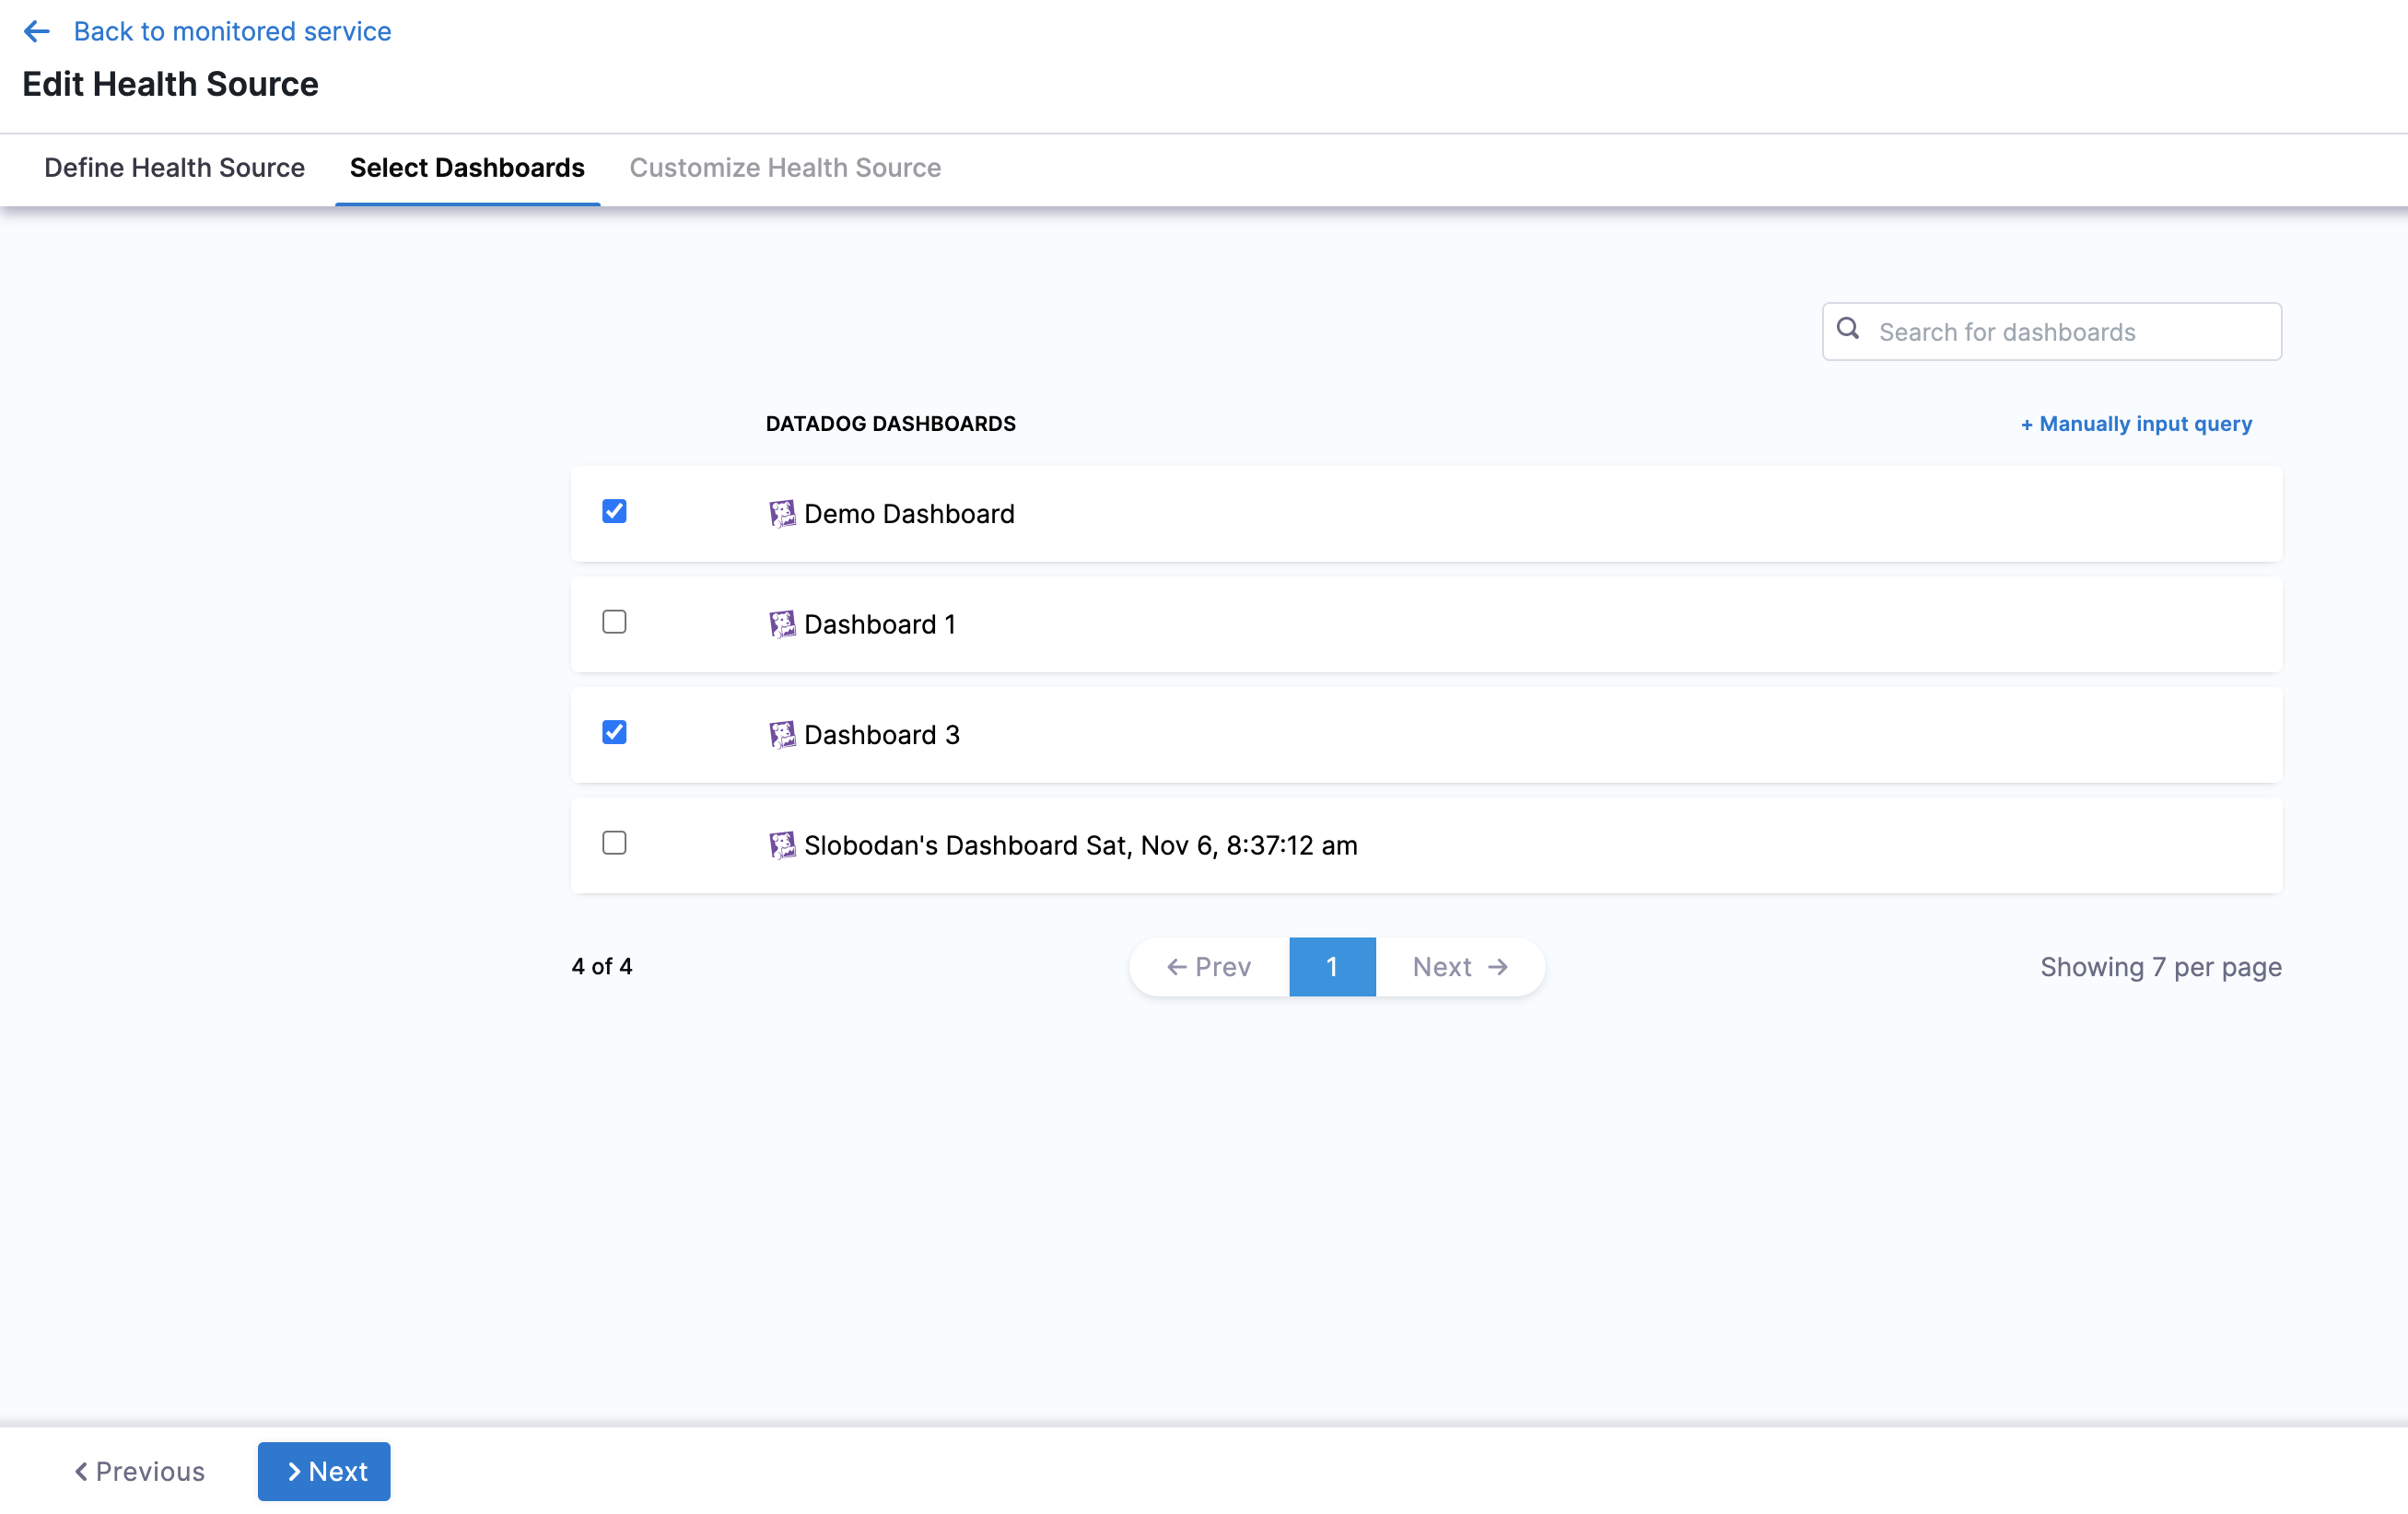
Click the dashboards of your choice. If you don't have any preexisting dashboards or don't want to select the ones in the displayed result, click Manually input query.
Click Next and the Customize Health Source settings appear.
Select a query from the options displayed on the left side of setting panel. The specification of the selected query auto-populates in the fields under Query Specifications.
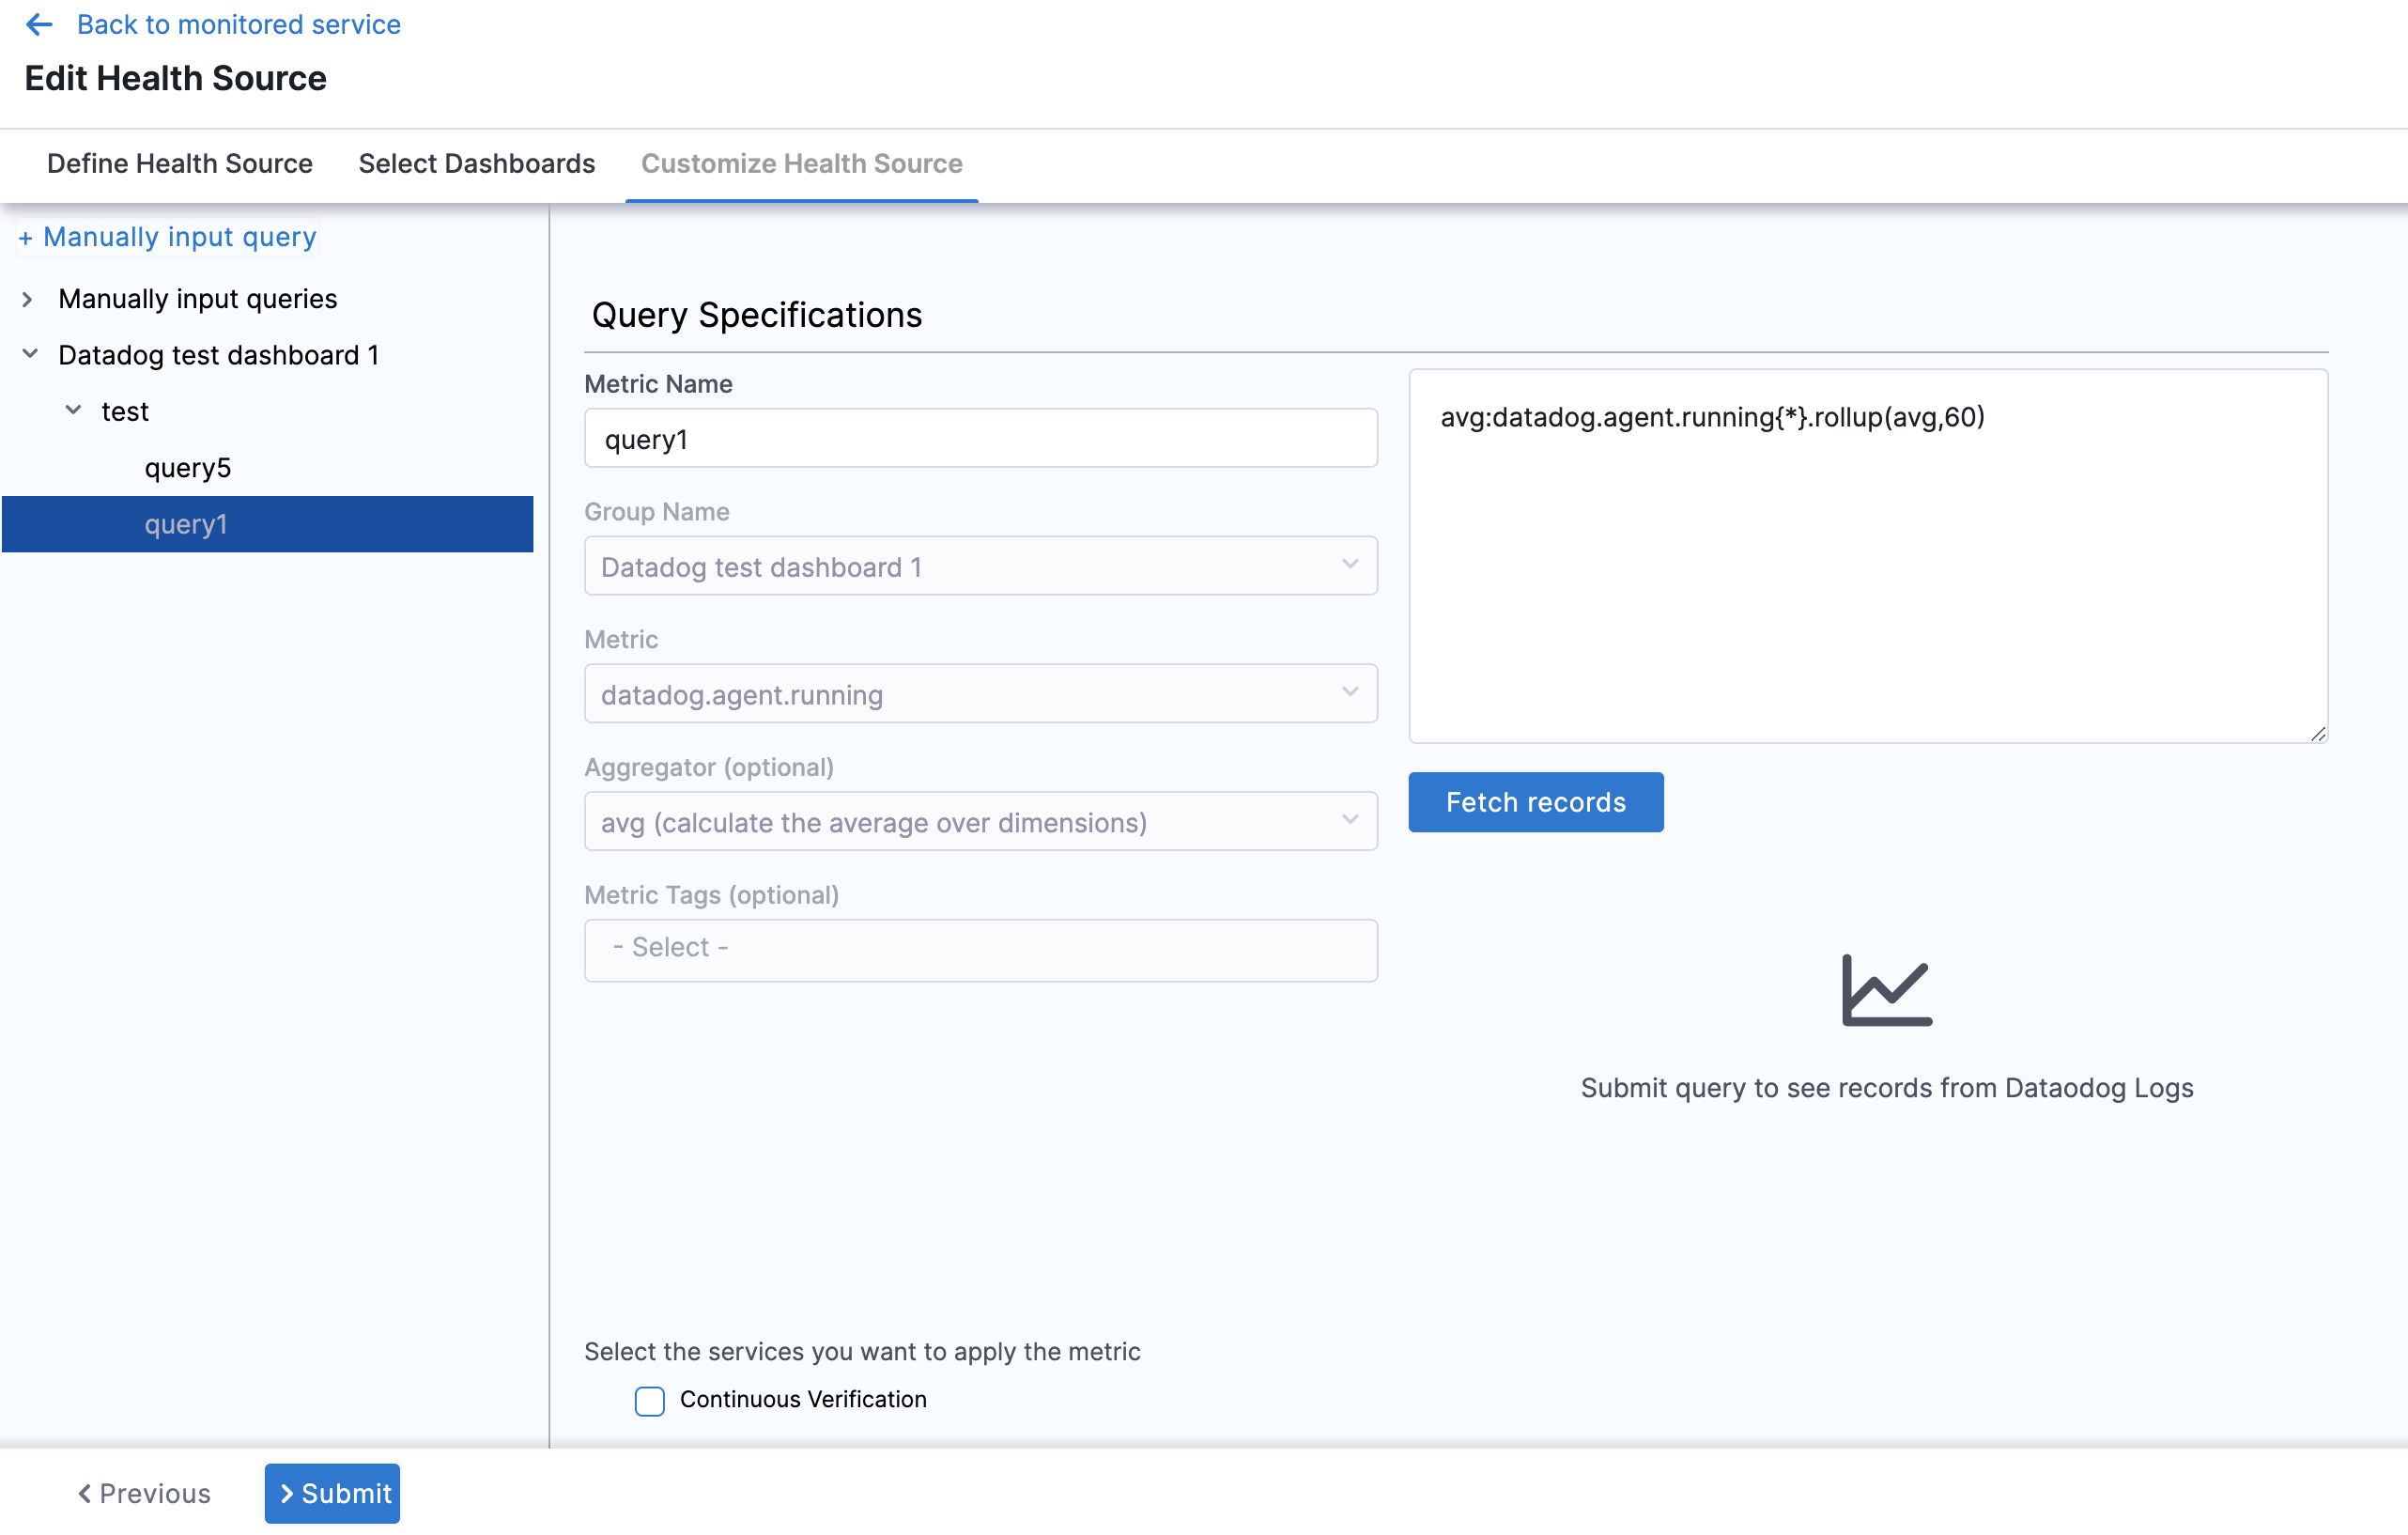
Click Submit. The Health Source is displayed in the AI Verify (v1) step.
Configure Datadog formulas as Harness queries
In manual query mode, the Datadog metrics health source provides support for formulas. These formulas follow a specific format:
Query a ; Query b ; Formula using a, b
- Query a: "Query-with-a"
- Query b: "Query-with-a"
- The formula is "(a/b) * 100 - 5"
Let's consider an example to illustrate this:
kubernetes.cpu.usage{cluster-name:chi-play};kubernetes.memory.total{cluster-name:chi-play};(a/b) * 100 - 5
In the example above, 'a' and 'b' represent the respective queries:
- a = kubernetes.memory.usage{cluster-name:chi-play}
- b = kubernetes.memory.total{cluster-name:chi-play}
You can use multiple queries represented by alphabetical variables (example: a, b, c, and so on) in the final formula, but only one formula is allowed per query.
Commonly used Datadog queries
Performance
- P90:
synthetics.http.response.time.distrib{availability_zone:*}, pod=~"harness-dummy-.*"}[5m])) by (le)) - P50:
synthetics.http.response.time.distrib{availability_zone:*}
API
- 5xx response:
sum:synthetics.http.response{status_code_class:5xx}.as_rate() , sum:synthetics.http.response{status_code:502}.as_rate() - 4xx response:
sum:synthetics.http.response{status_code_class:4xx}.as_rate() , sum:synthetics.http.response{status_code:401}.as_rate()
Infrastructure
- CPU:
per_minute(sum:container.cpu.usage{cluster_name:del-play-* cluster-location:us-*}) , system.cpu.num_cores{*} ; Final Value: a/b * 100 - Memory:
per_minute(sum:container.cpu.usage{cluster_name:del-**, cluster-location:us-**})
Option: Cloud Logs
Select Cloud Logs and click Next. The Customize Health Source settings appear.
You can customize the metrics to map the Harness Service to the monitored environment in Query Specifications and Mapping settings.
Click Map Queries to Harness Services dropdown.
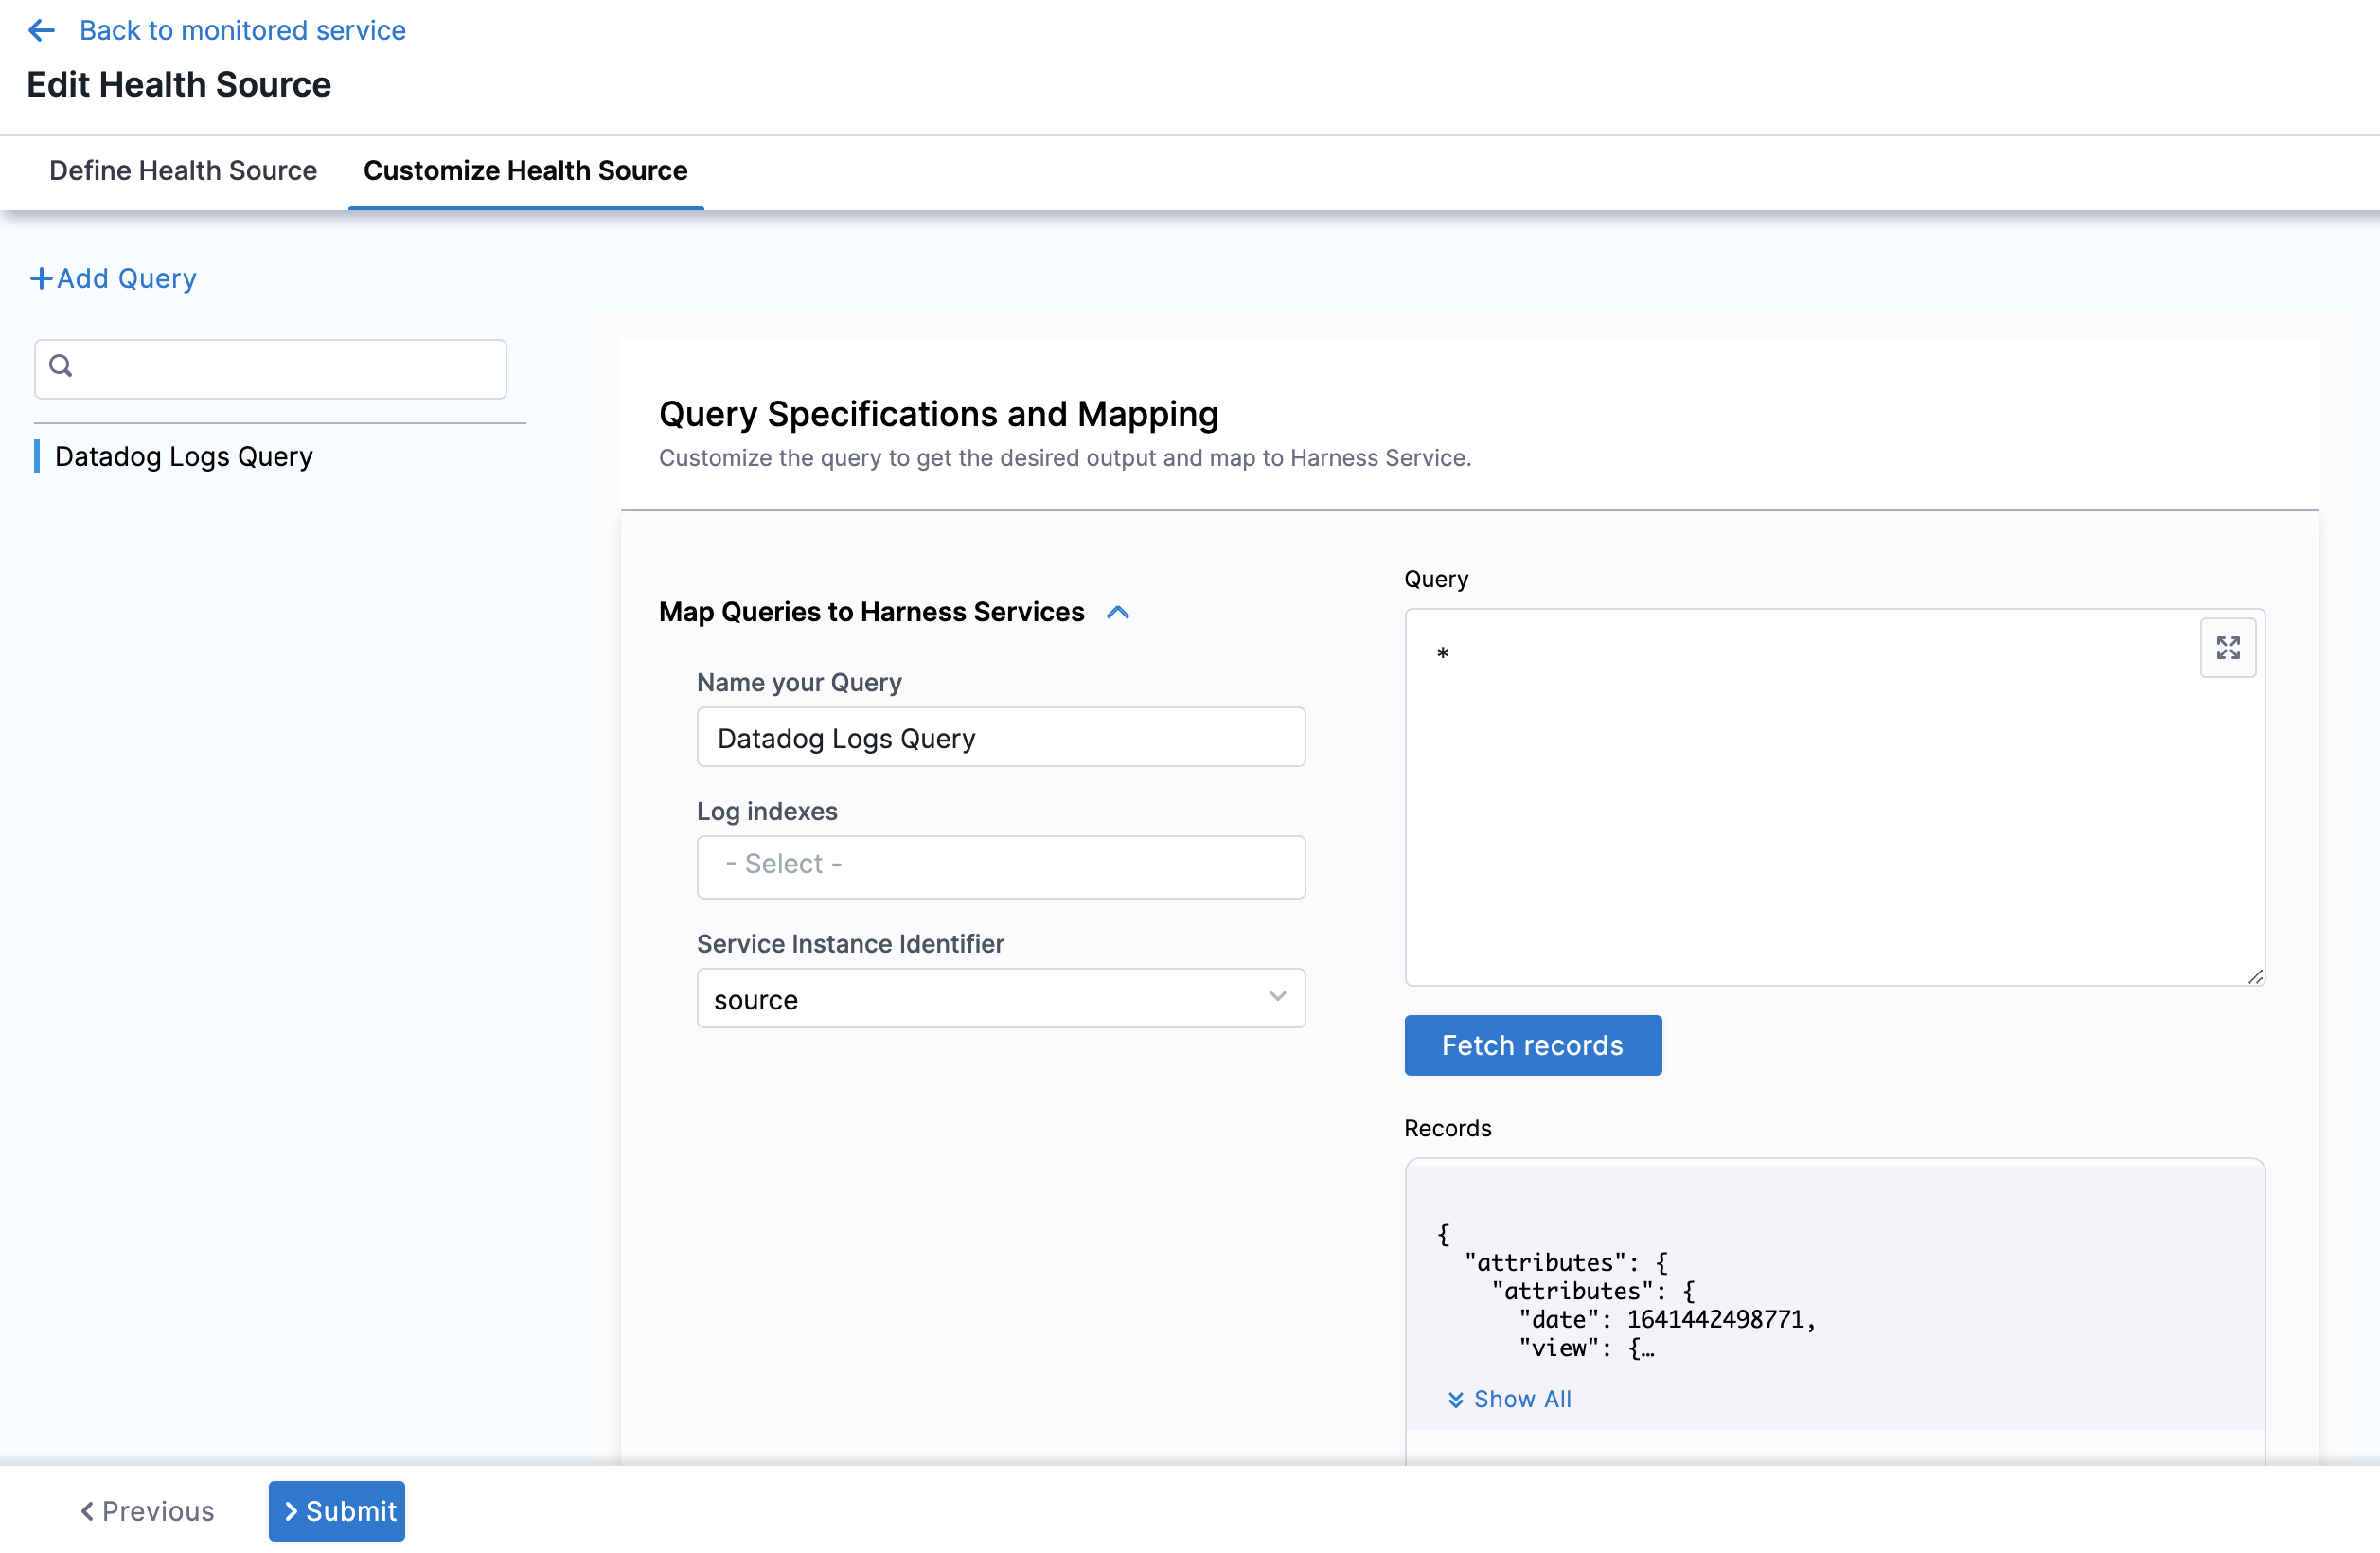
Enter a name for the query in Name your Query.
In Log Indexes, select a log index from the list.
In Service Instance Identifier, select the drop-down and choose the path of the service instance. Any of the tags used in metric or log can be used as service instance identifier. It should correspond to instances that are running. The drop-down list contains all the tags returned by data through the API. For more information, go to List tags by metric name.
Click Submit. The Health Source is displayed in the AI Verify (v1) step.