New Relic
Before you begin
This page assumes you have followed the rest of the steps to set up CV. To learn more, go to Configure CV
New Relic supports multiple APIs. The Harness Connector leverages the New Relic Insights API, which supports NRQL. Your Service/Application also needs to be instrumented as a New Relic APM Application.
Add New Relic as a health source
This option is available only if you have configured the service and environment as fixed values.
A Health Source is basically a mapping of a Harness Service to the service in a deployment environment monitored by an APM or logging tool.
-
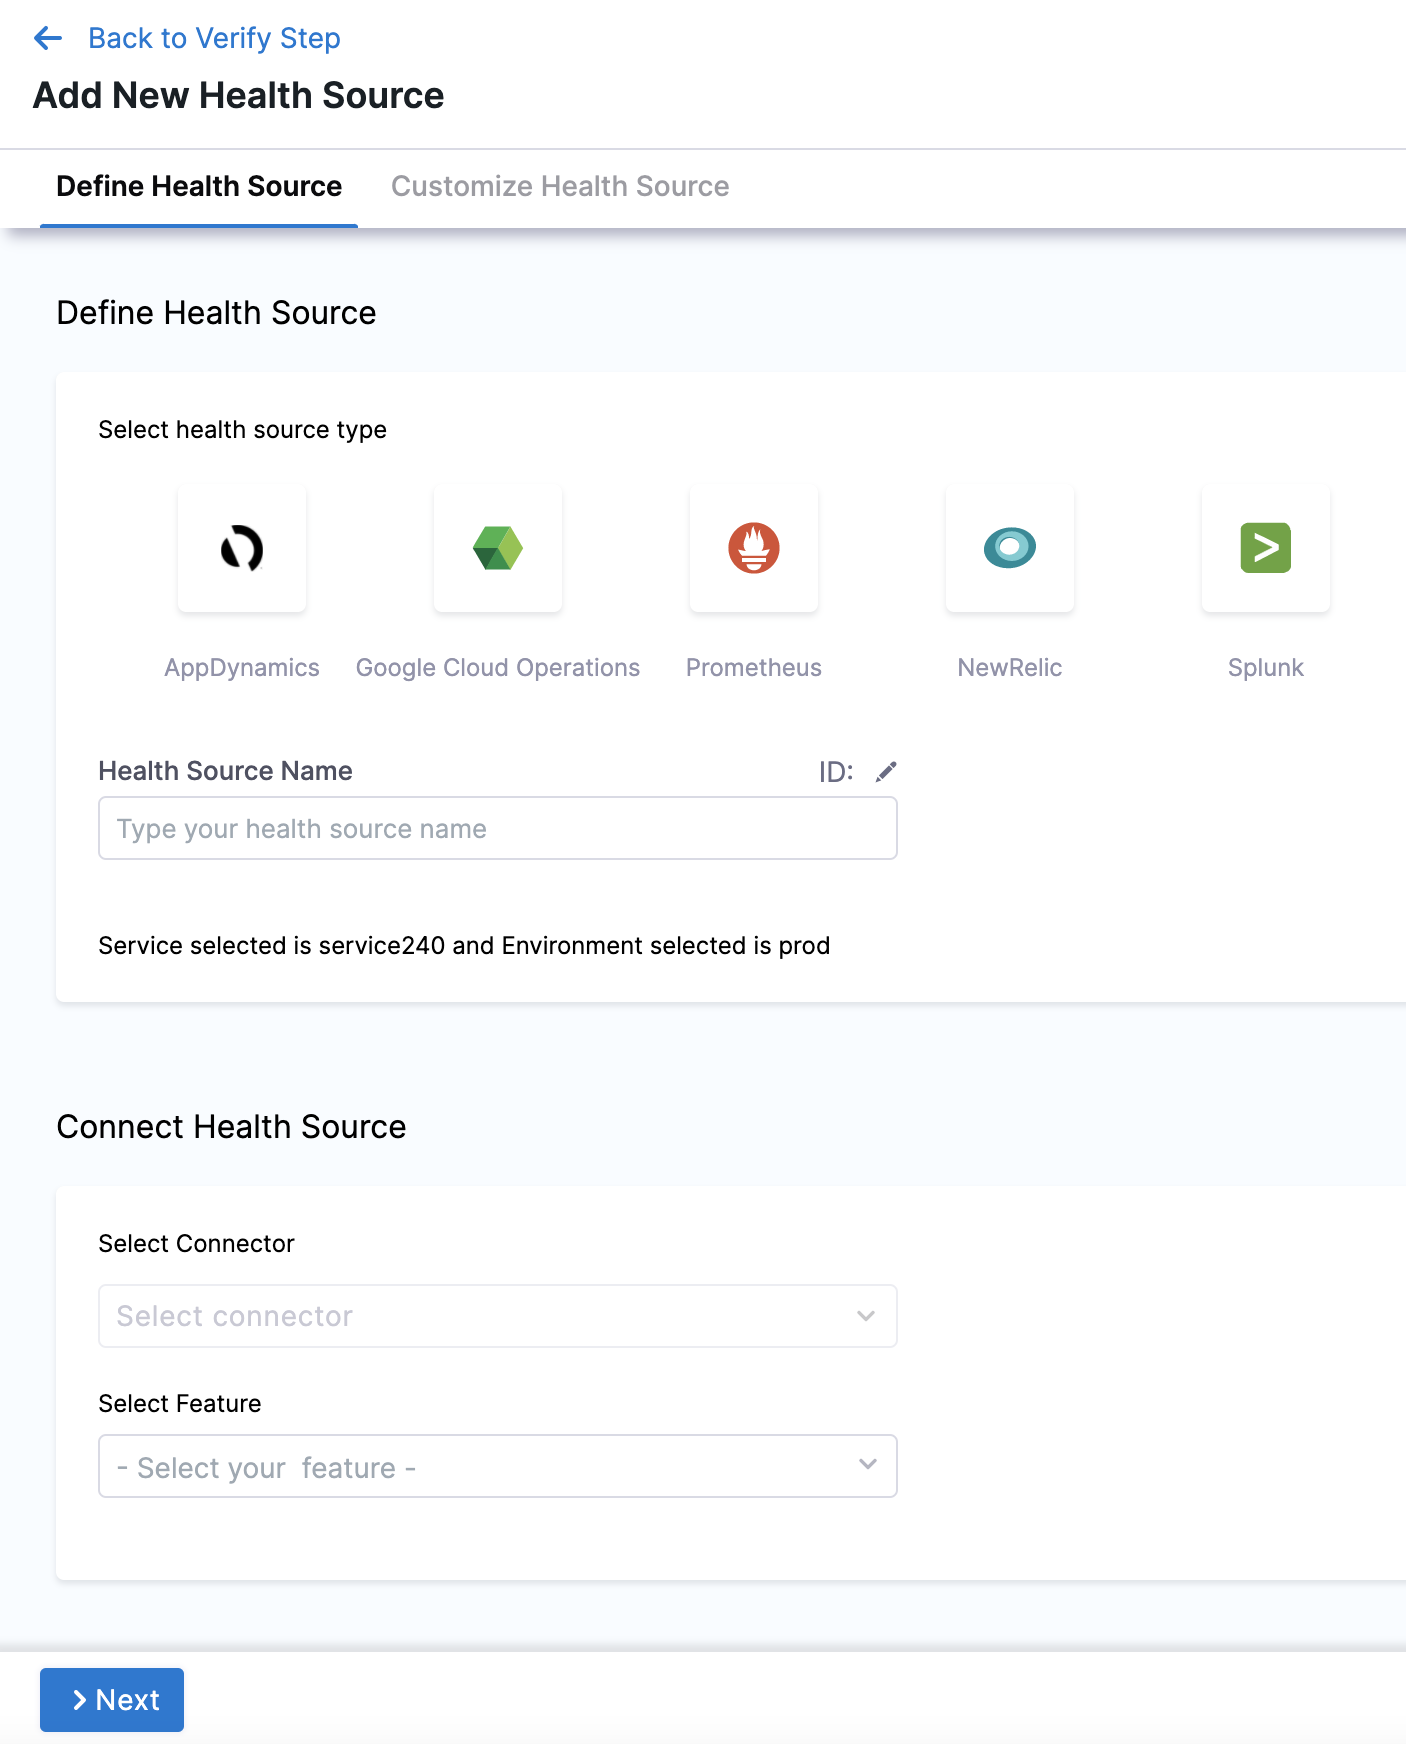
In Health Sources, click Add. The Add New Health Source settings appear.
-
In Select health source type, select NewRelic.
-
In Health Source Name, enter a name for the Health Source.
-
Under Connect Health Source, click Select Connector.
-
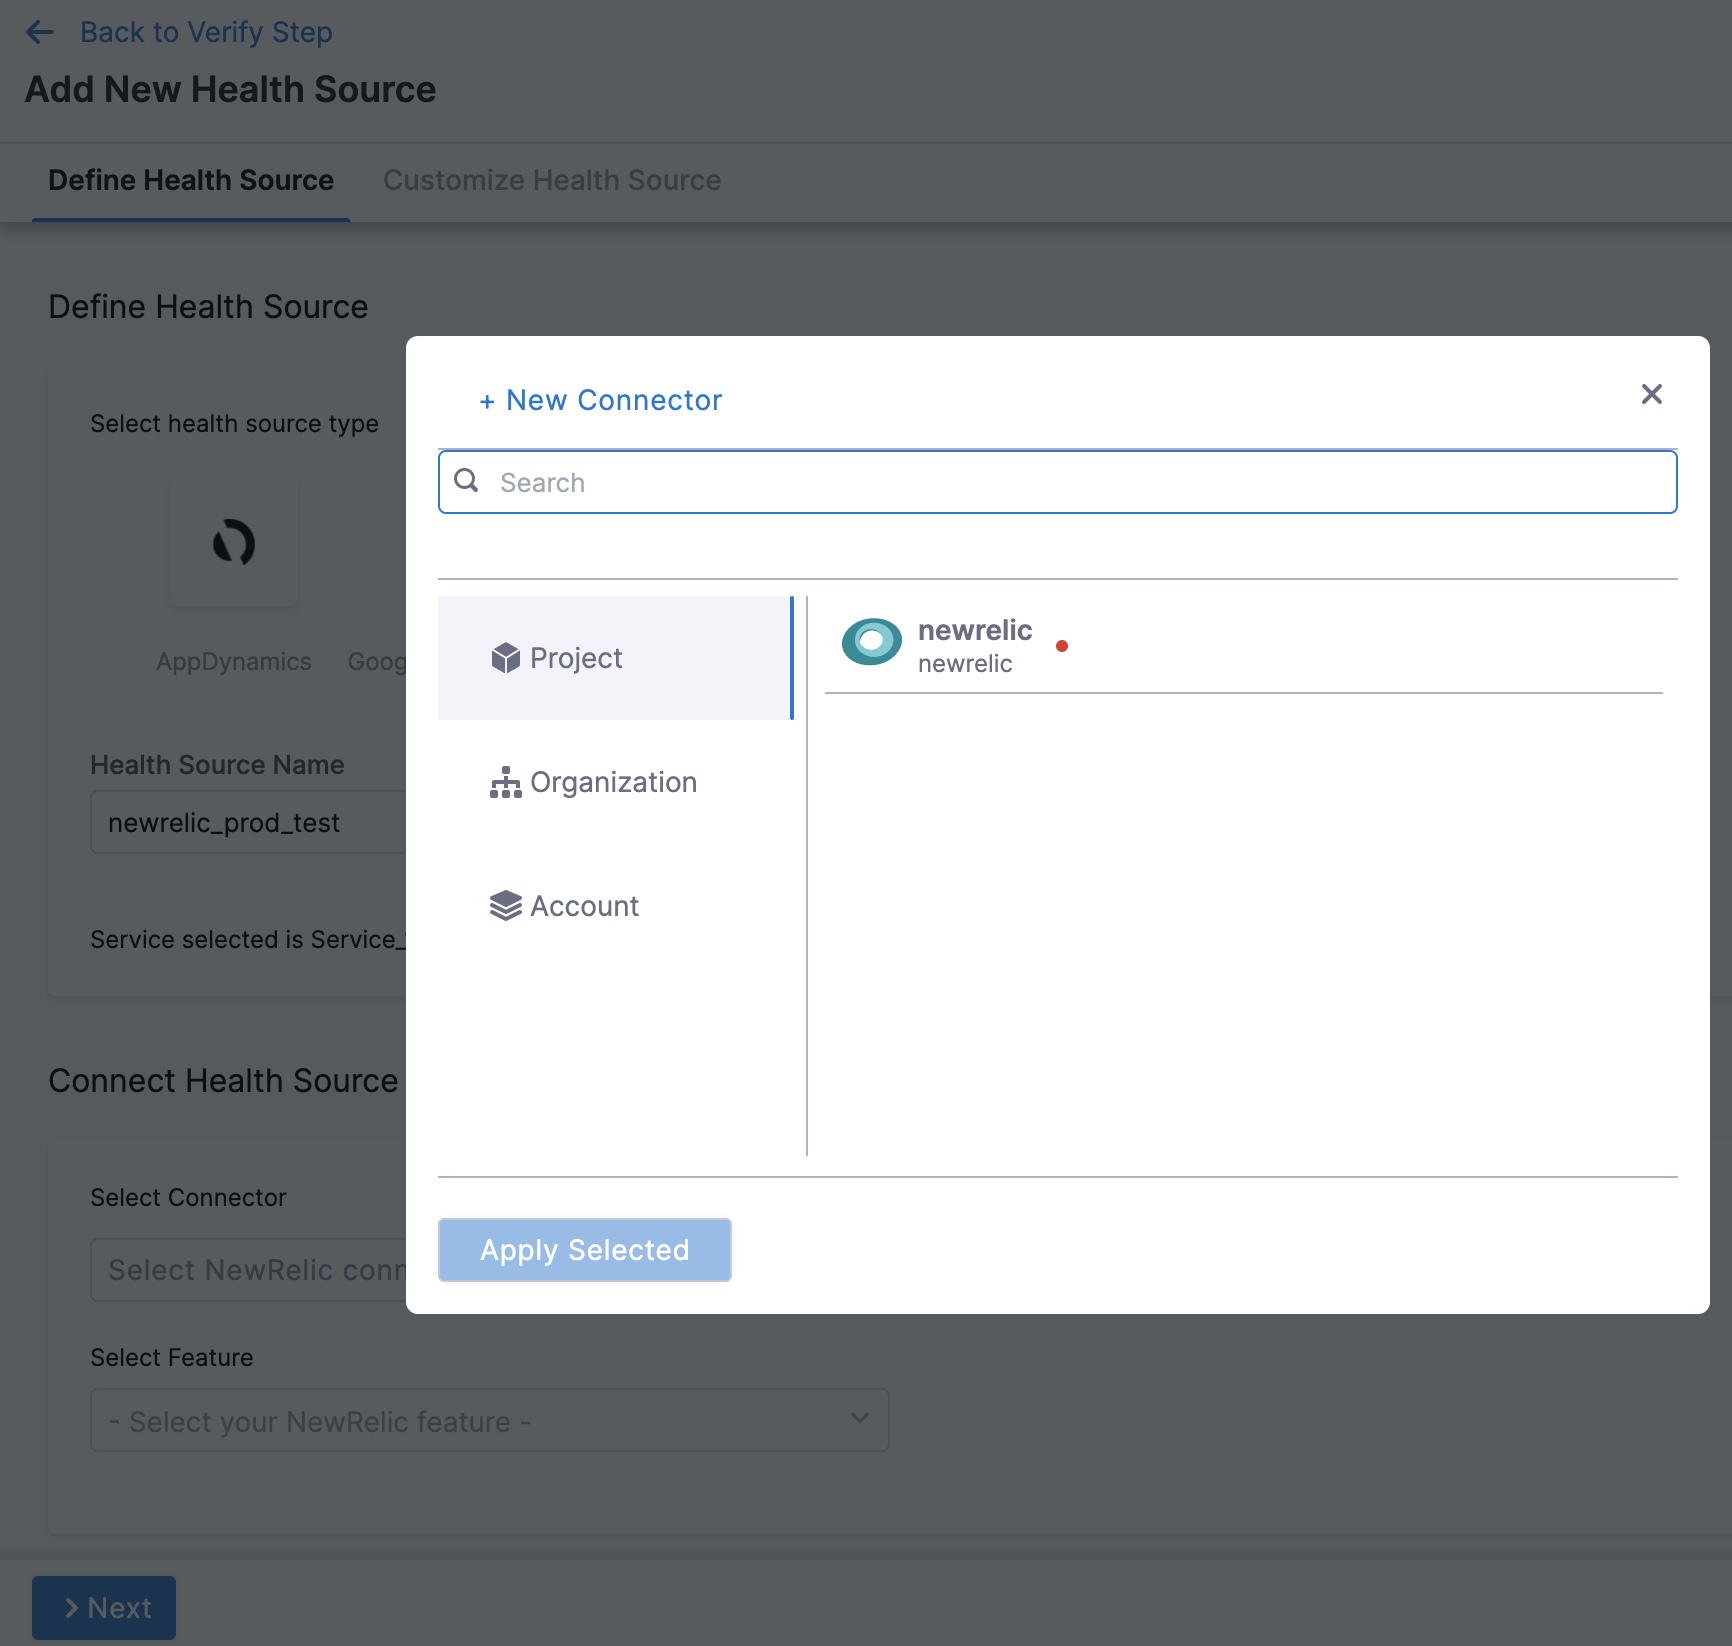
In Connector settings, you can either choose an existing connector or click New Connector.
New Relic supports multiple APIs. Harness connector leverages the NerdGraph API or the deprecated New Relic Insights API that supports NRQL. See Step 8 for more details on connecting to either APIs. For more details, go to Add New Relic connector.
-
Click Apply Selected. The Connector is added to the Health Source.
-
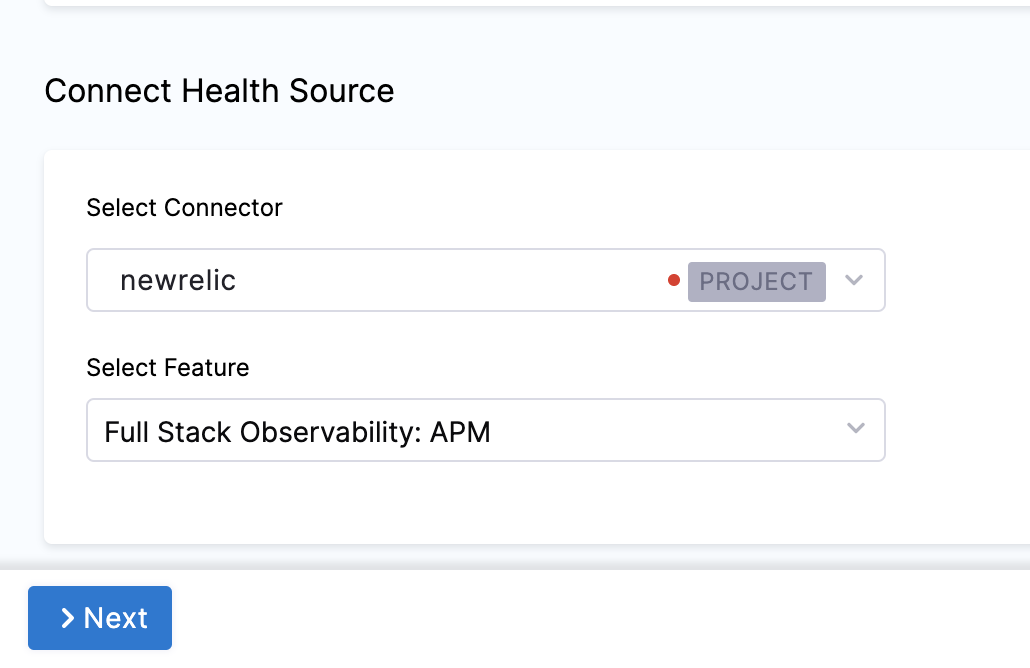
In Select Feature, select the NewRelic feature to be used. Currently, only Full Stack Observability: APM feature is available and it is selected by default.
-
Click Next. The Configuration page appears.
-
Select the Performance checkbox under Metric Packs for Harness to monitor the performance metrics.
-
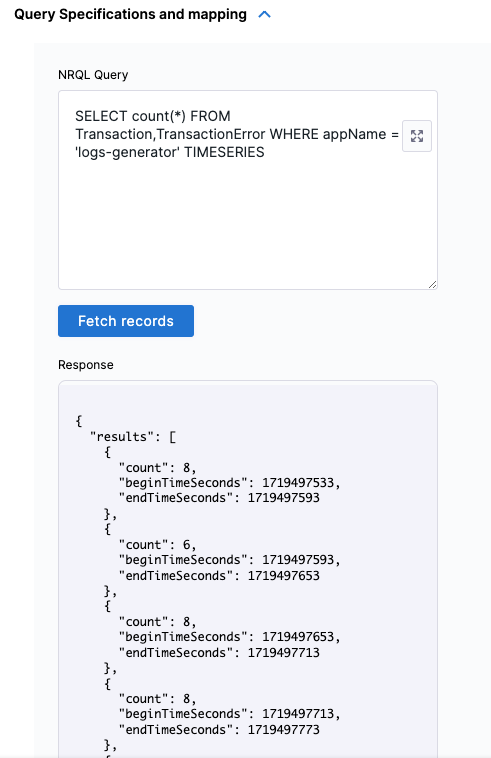
Under Query Specifications and Mapping, select Add Metric to customize the query to get the desired output and map to Harness service.
- In Map Metric(s) to Harness Services, enter a Metric Name and Group Name.
- In Query Specifications and mapping, enter the NRQL Query, and then select Fetch Records. (Optional: Enter the NRQL for specified metrics with a
TimeSeriesclause.)
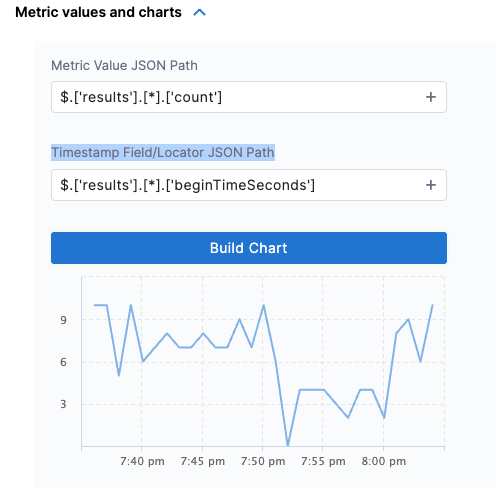
- In Metric values and charts, select a Metric Value JSON Path and Timestamp Field/Locator JSON Path and select Build Chart.
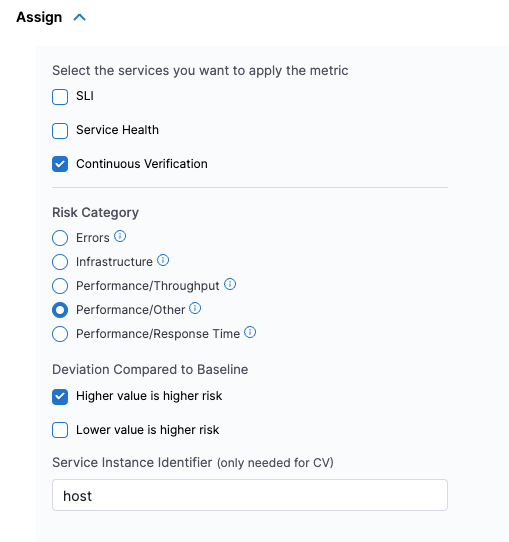
- In Assign:
- In Select the services you want to apply the metric, select Continuous Verification (Applied to the pipelines in the Continuous Deployment).
- In Risk Category, select Performance/Other
- In Deviation Compared To Baseline, select Higher counts = higher risk.
- In Service Instance Identifier (only needed for CV), enter host.
-
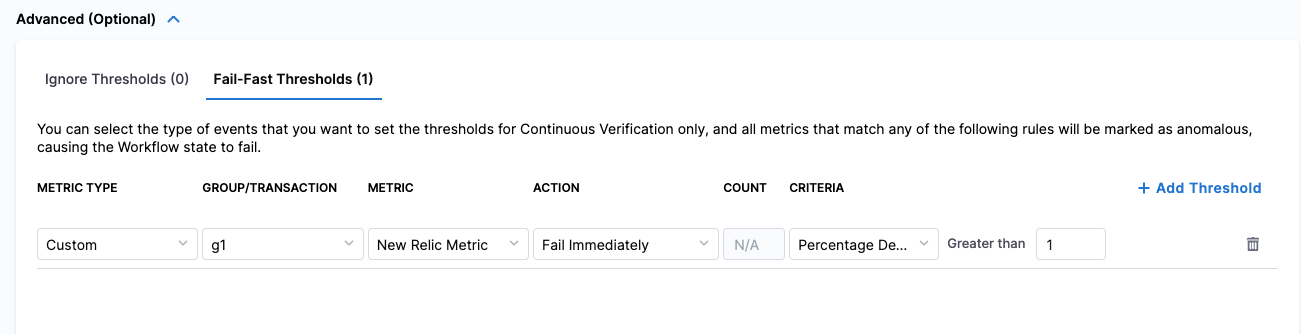
(Optional) To set a fail-fast threshold, follow these steps:
-
Expand Advanced (Optional), go to the Fail-Fast Thresholds tab, and then select Add Threshold.
-
From the Metric drop-down, select New Relic Metric. This is the metric you created in the Define metric configuration settings step.
-
In the Action field, select what the CV should do when applying the rule. For example, Fail Immediately.
-
In the Criteria field, choose Percentage Deviation, and from Greater than select 1. This sets a threshold for memory usage beyond which the system or application is considered to be in a problematic state, and action should be taken.
-
-
Select Submit. The Health Source is displayed in the AI Verify (v1) step.
You can add one or more Health Sources for each APM or logging provider.
Sample New Relic queries
Here are few sample New Relic queries:
SELECT rate(count(duration), 1 minute) FROM Transaction TIMESERIESSELECT average(duration) FROM Transaction TIMESERIESSELECT average(`apm.service.transaction.duration`) FROM Metric WHERE appId = 1329709976 TIMESERIES
For more details on NRQL structure and how to use it, go to New Relic documentation.