Grafana Loki
Currently, this feature is behind the feature flag SRM_ENABLE_GRAFANA_LOKI_LOGS. Contact Harness Support to enable the feature.
Before you begin
This page assumes you have followed the rest of the steps to set up CV. To learn more, go to Configure CV
Add Grafana Loki as a health source
To add a health source:
-
In the Health Sources section of the Verify screen, select + Add New Health Source.
The Add New Health Source dialog appears.
-
In the Define Health Source tab, do the following:
-
In the Define Health Source section, select GrafanaLoki as the health source type.
-
In the Health Source Name field, enter a name for the health source.
-
In the Connect Health Source section, select Select Connector.
The Create or Select an Existing Connector dialog appears.
-
Select a connector for the Grafana Loki health source, and then select Apply Selected.
The selected connector appears in the Select Connector dropdown. The Grafana Loki Logs option is selected by default in the Select Feature field.
-
Follow these steps to create a new Grafana Loki connector.
-
In the Create or Select an Existing Connector dialog, select + New Connector.
-
In the Overview tab, enter a name for the connector, an optional description, and a tag, and then select Continue. If you are going to use multiple providers of the same type, ensure you give each provider a different name.
-
In the Headers tab, enter the following and select Next:
- Base URL of your Grafana Loki account. By default, Grafana Loki exposes its API on the 3100 port without any authentication.
- Optionally, the Key and Value pair for the Grafana Loki log stream that you want to select in the query. For more information on the log stream selector and key-value pairs, go to Log stream selector.
-
Optionally, in the Parameters tab, enter the Key and Value pair.
-
In the Validation Path tab, select either the GET or POST request method and enter the Validation Path.
If you select POST, you must also include the request body. Here's an example of a validation path for a GET request:
loki/api/v1/labels. -
In the Delegates Setup tab, choose one of the following:
-
Use any available Delegate: Harness automatically assigns an available delegate.
-
Only use Delegates with all of the following tags: You can enter tags to ensure that Harness selects only the delegates that have been assigned those specific tags.
-
-
Select Save and Continue.
Harness verifies the connection.
-
Once the verification is successful, select Finish.
The Grafana Loki connector is added to the list of connectors.
- Select Next. The Configuration tab appears.
Define log configuration settings
-
In the Configuration tab, select + Add Query.
The Add Query dialog appears.
-
Enter a name for the query and then select Submit.
The query that you added gets listed under Logs Group. The query specification and mapping settings are displayed. These settings help you retrieve the desired logs from the Grafana Loki platform and map them to the Harness service.
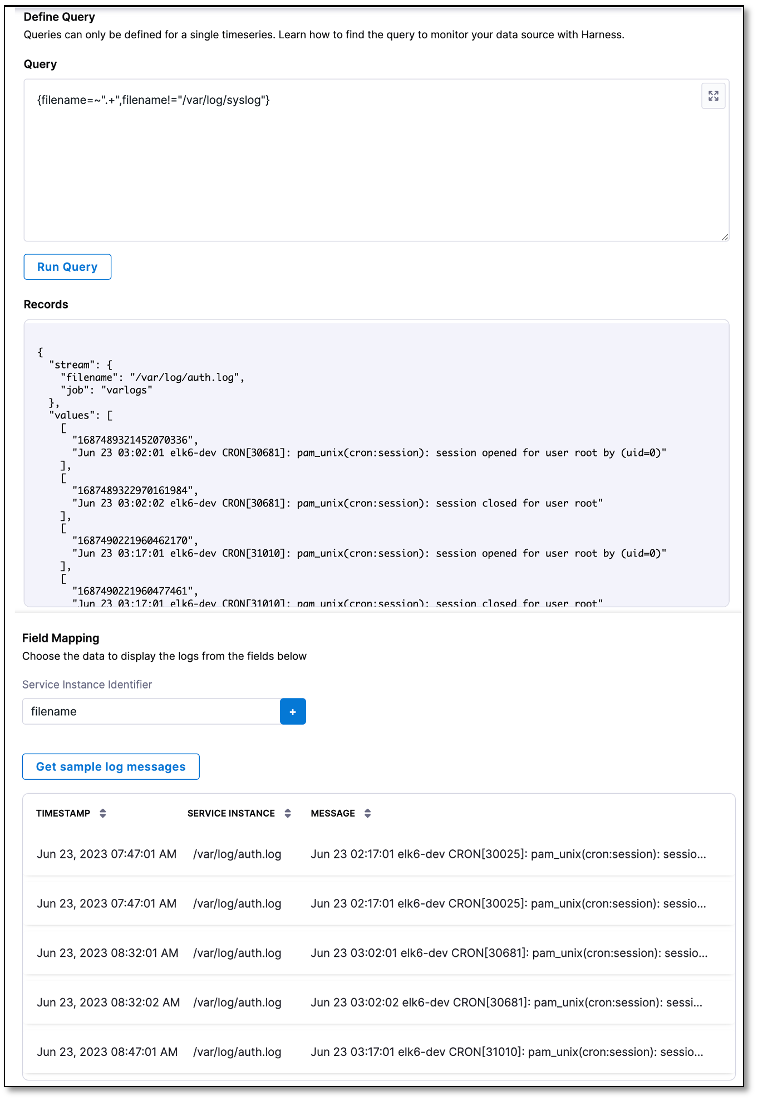
Define a query
-
In the Query field, enter a log query and select Run Query to execute it.
A sample record in the Records field. This helps you confirm the accuracy of the query you've constructed.
-
In the Field Mapping section, select + to map the service instance identifiers to select the data that you want to be displayed from the logs. For more information, go to Service Instance Identifier (SII).
-
Select Get sample log messages.
Sample logs are displayed that help you verify if the query is correct.
Sample log query
Query for showing data from all filenames, except for syslog: {filename=~".+",filename!="/var/log/syslog"}